


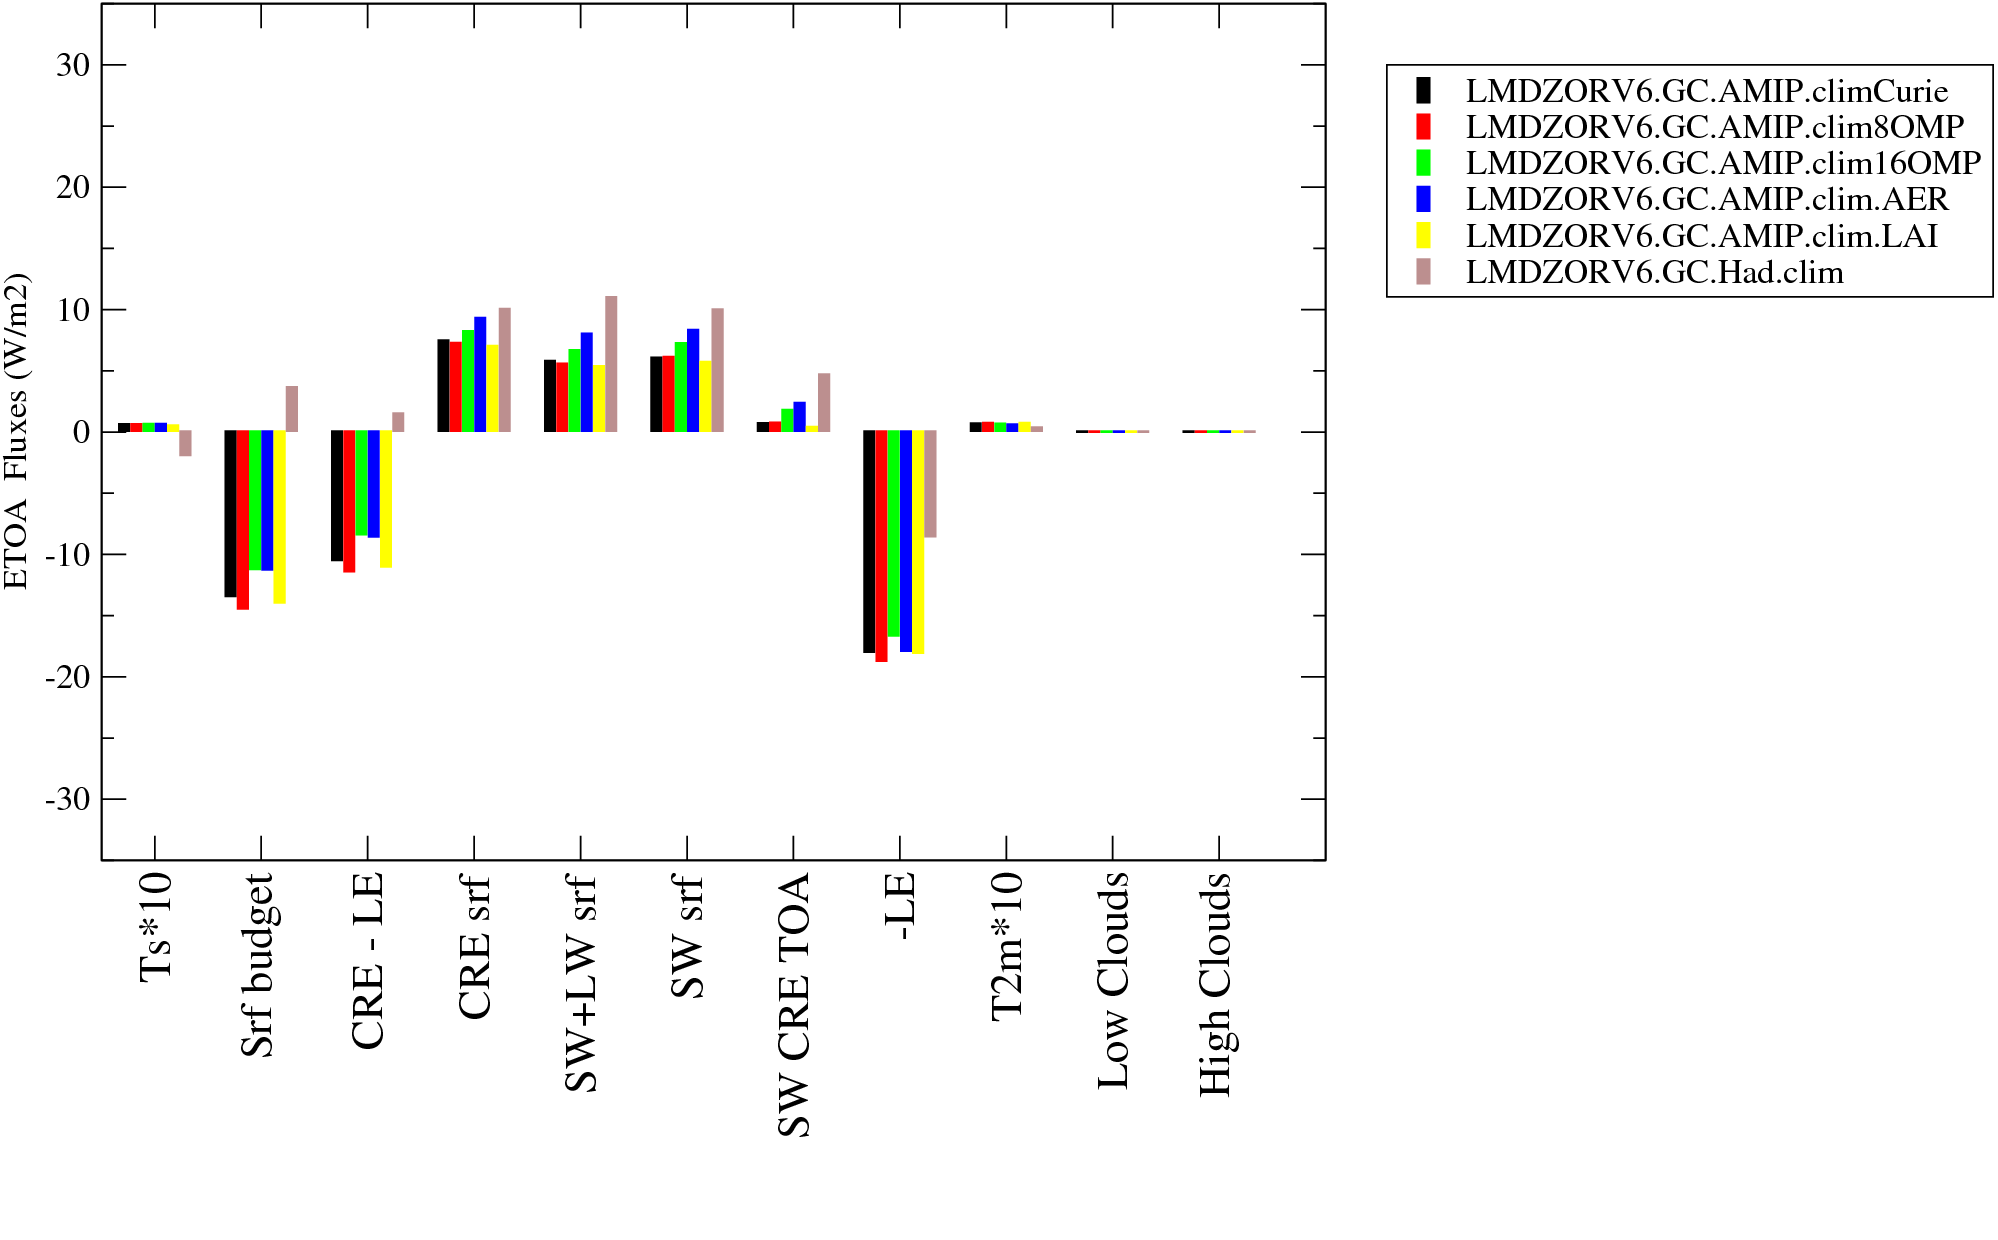


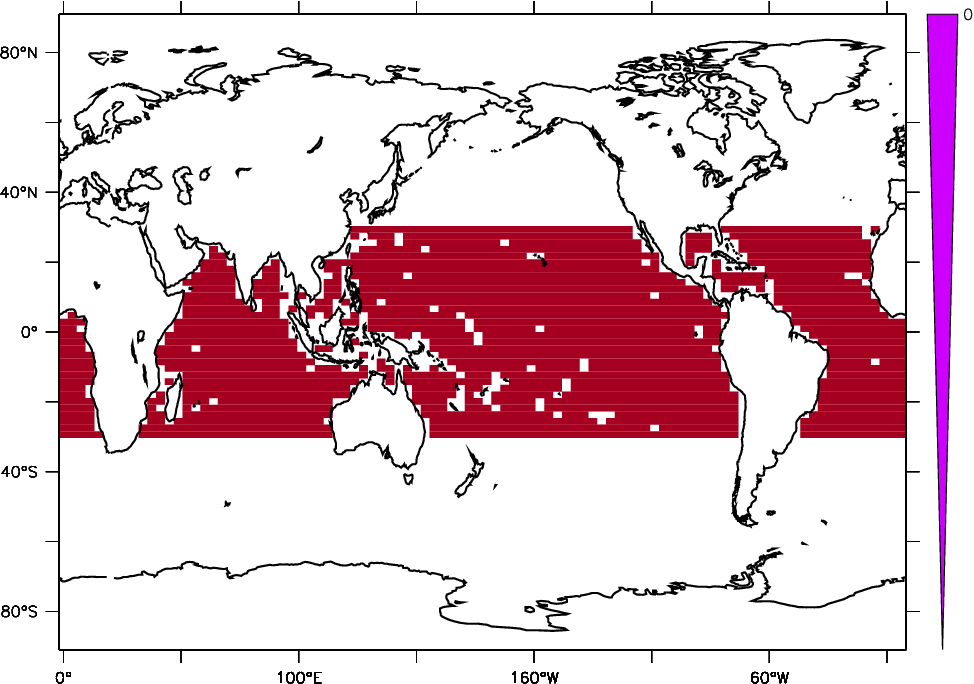


| RUN (link to outputs) | Atlas YEAR | Atlas --DJF-- | Atlas --JJA-- | Description of the simulation ______________________________ | Period | Name (link to parameters) | bils | rt | rst | rlut | rlutcs | crest | crelt | cret | eva | pr | prw |
| CLIMATOS | 7.097 | 0.7823 | 240.4 | 239.6 | 269.4 | -47.05 | 29.84 | -17.21 | 3.415 | 2.61 | 27.46 | ||||||
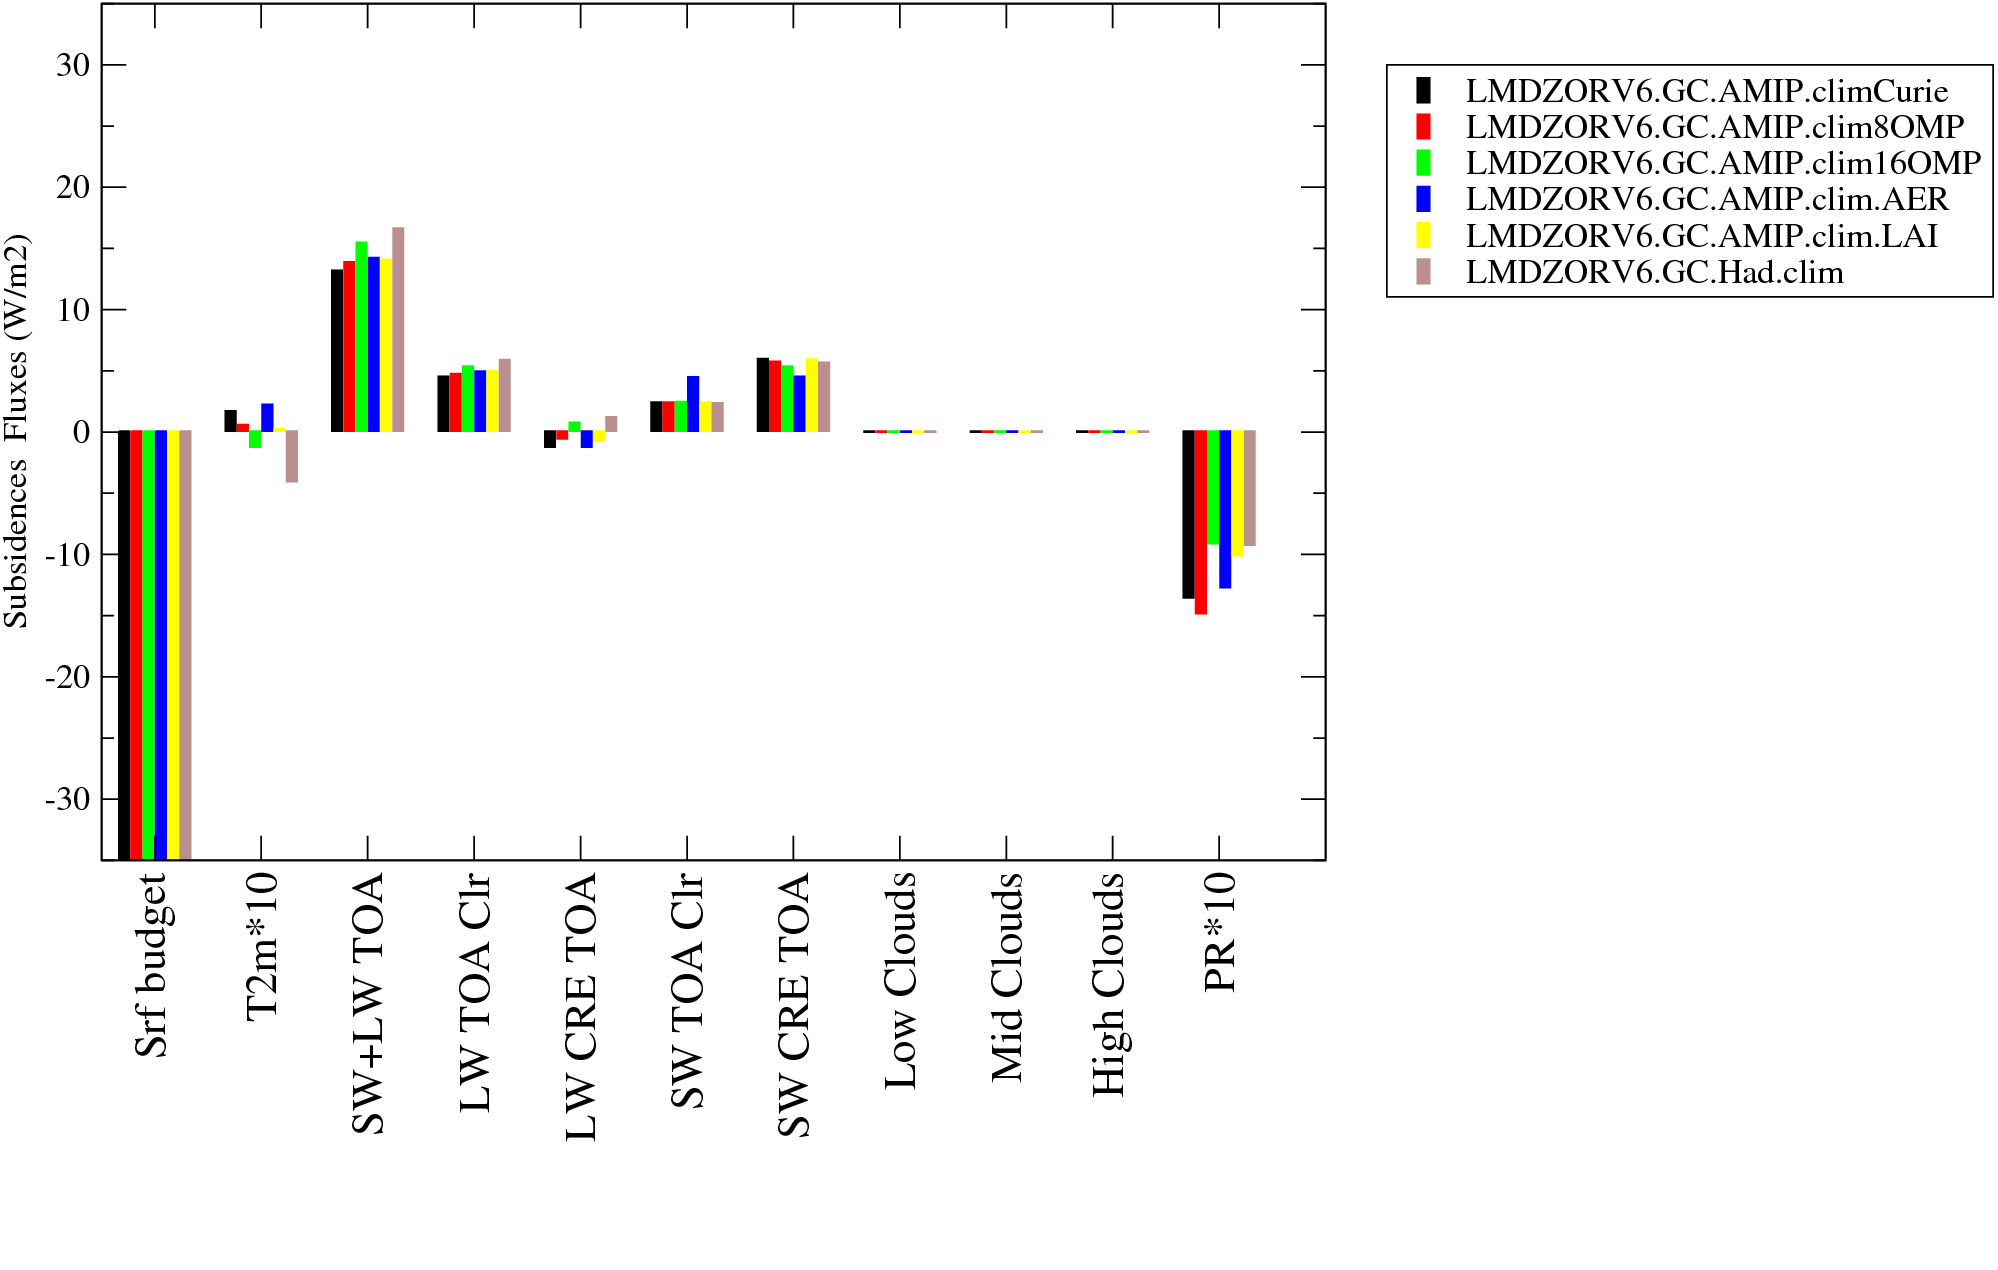
| LMDZORV6.GC.AMIP.climCurie | G - - | G - - | G - - | LMDZORV6 curie | 1995_2004 | LMDZORV6.GC.AMIP.climCurie | 3.7193 | 2.987 | 240.435 | 237.448 | 262.393 | -48.3421 | 24.945 | -23.3971 | 3.02752 | 25.3076 | |
| LMDZORV6.GC.AMIP.clim8OMP | G - - | G - - | G - - | AMIP clim 8OMP | 1995_2004 | LMDZORV6.GC.AMIP.clim8OMP | 3.7359 | 3.006 | 240.365 | 237.359 | 262.297 | -48.403 | 24.938 | -23.465 | 3.02796 | 25.3126 | |
| LMDZORV6.GC.AMIP.clim16OMP | G - - | G - - | G - - | LMDZORV6 AMIP clim 16OMP | 1995_2004 | LMDZORV6.GC.AMIP.clim16OMP | 3.8024 | 3.057 | 241.043 | 237.986 | 262.397 | -47.7416 | 24.411 | -23.3306 | 3.02437 | 25.2782 | |
| LMDZORV6.GC.AMIP.clim.AER | G - - | G - - | - - - | LMDZORV6 AER plume | 1995_2004 | LMDZORV6.GC.AMIP.clim.AER | 5.8678 | 5.1635 | 242.65 | 237.487 | 262.585 | -48.4313 | 25.098 | -23.3333 | 3.03283 | 25.2745 | |
| LMDZORV6.GC.AMIP.clim.LAI | G - - | G - - | G - - | LMDZORV6 LAI | 1995_2004 | LMDZORV6.GC.AMIP.clim.LAI | 3.9127 | 3.18 | 240.438 | 237.258 | 262.198 | -48.404 | 24.94 | -23.464 | 3.03631 | 25.3532 | |
| LMDZORV6.GC.Had.clim | G - - | G - - | G - - | LMDZOR SST HadISST | 1995_2004 | LMDZORV6.GC.Had.clim | 5.7725 | 4.986 | 241.777 | 236.791 | 260.414 | -46.2447 | 23.623 | -22.6217 | 2.93855 | 23.101 | |
| Siberia | US gr. plains | Arctic | N. Atlantic | Circum Antart. |
 |
 |
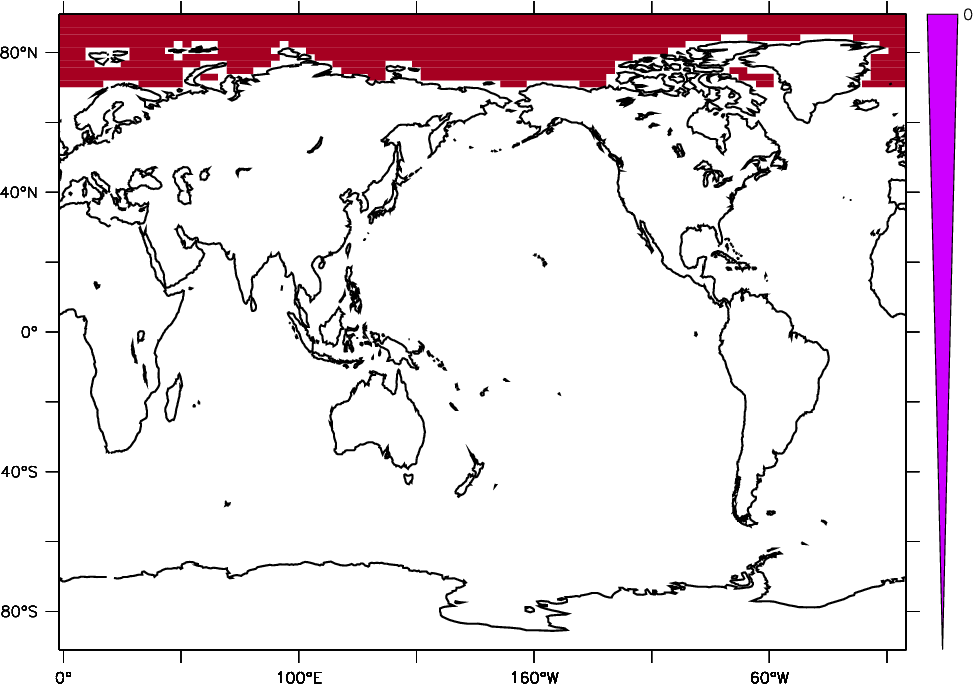 |
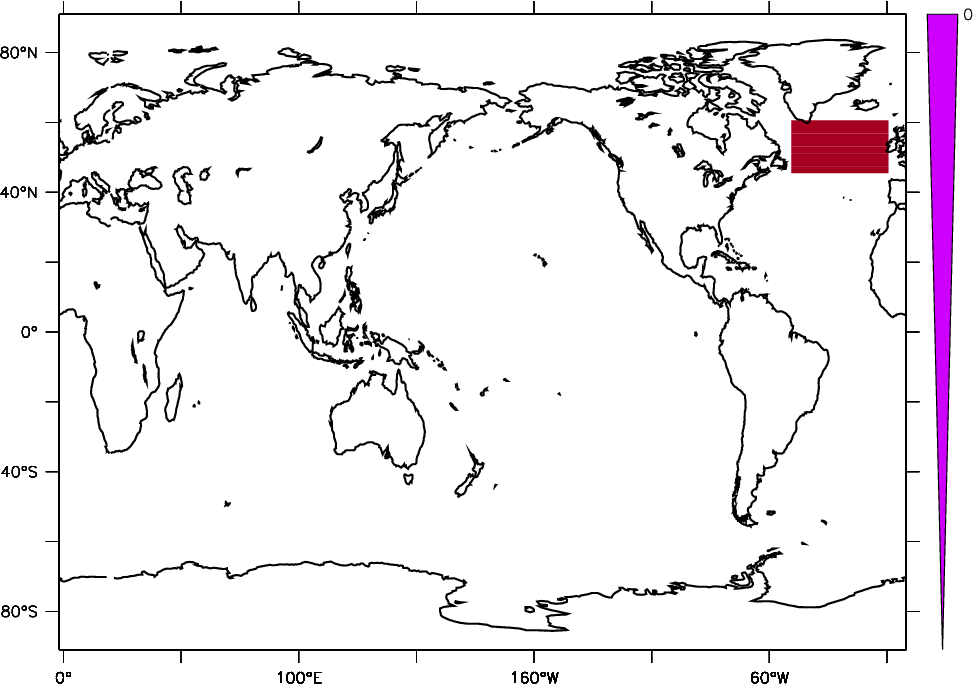 |
 |
 |
 |
 |
 |
 |
| Siberia | US gr. plains | Arctic | N. Atlantic | Circum Antart. |
 |
 |
 |
 |
 |
 |
 |
 |
 |
 |