| RUN |
Atlas YEAR |
Atlas --DJF-- |
Atlas --JJA-- |
Description of the simulation _____________________________________ |
Name |
Period |
bils |
rt |
rst |
rlut |
rlutcs |
crest |
crelt |
cret |
eva |
pr |
prw |
| CLIMATOS |
|
|
|
|
|
|
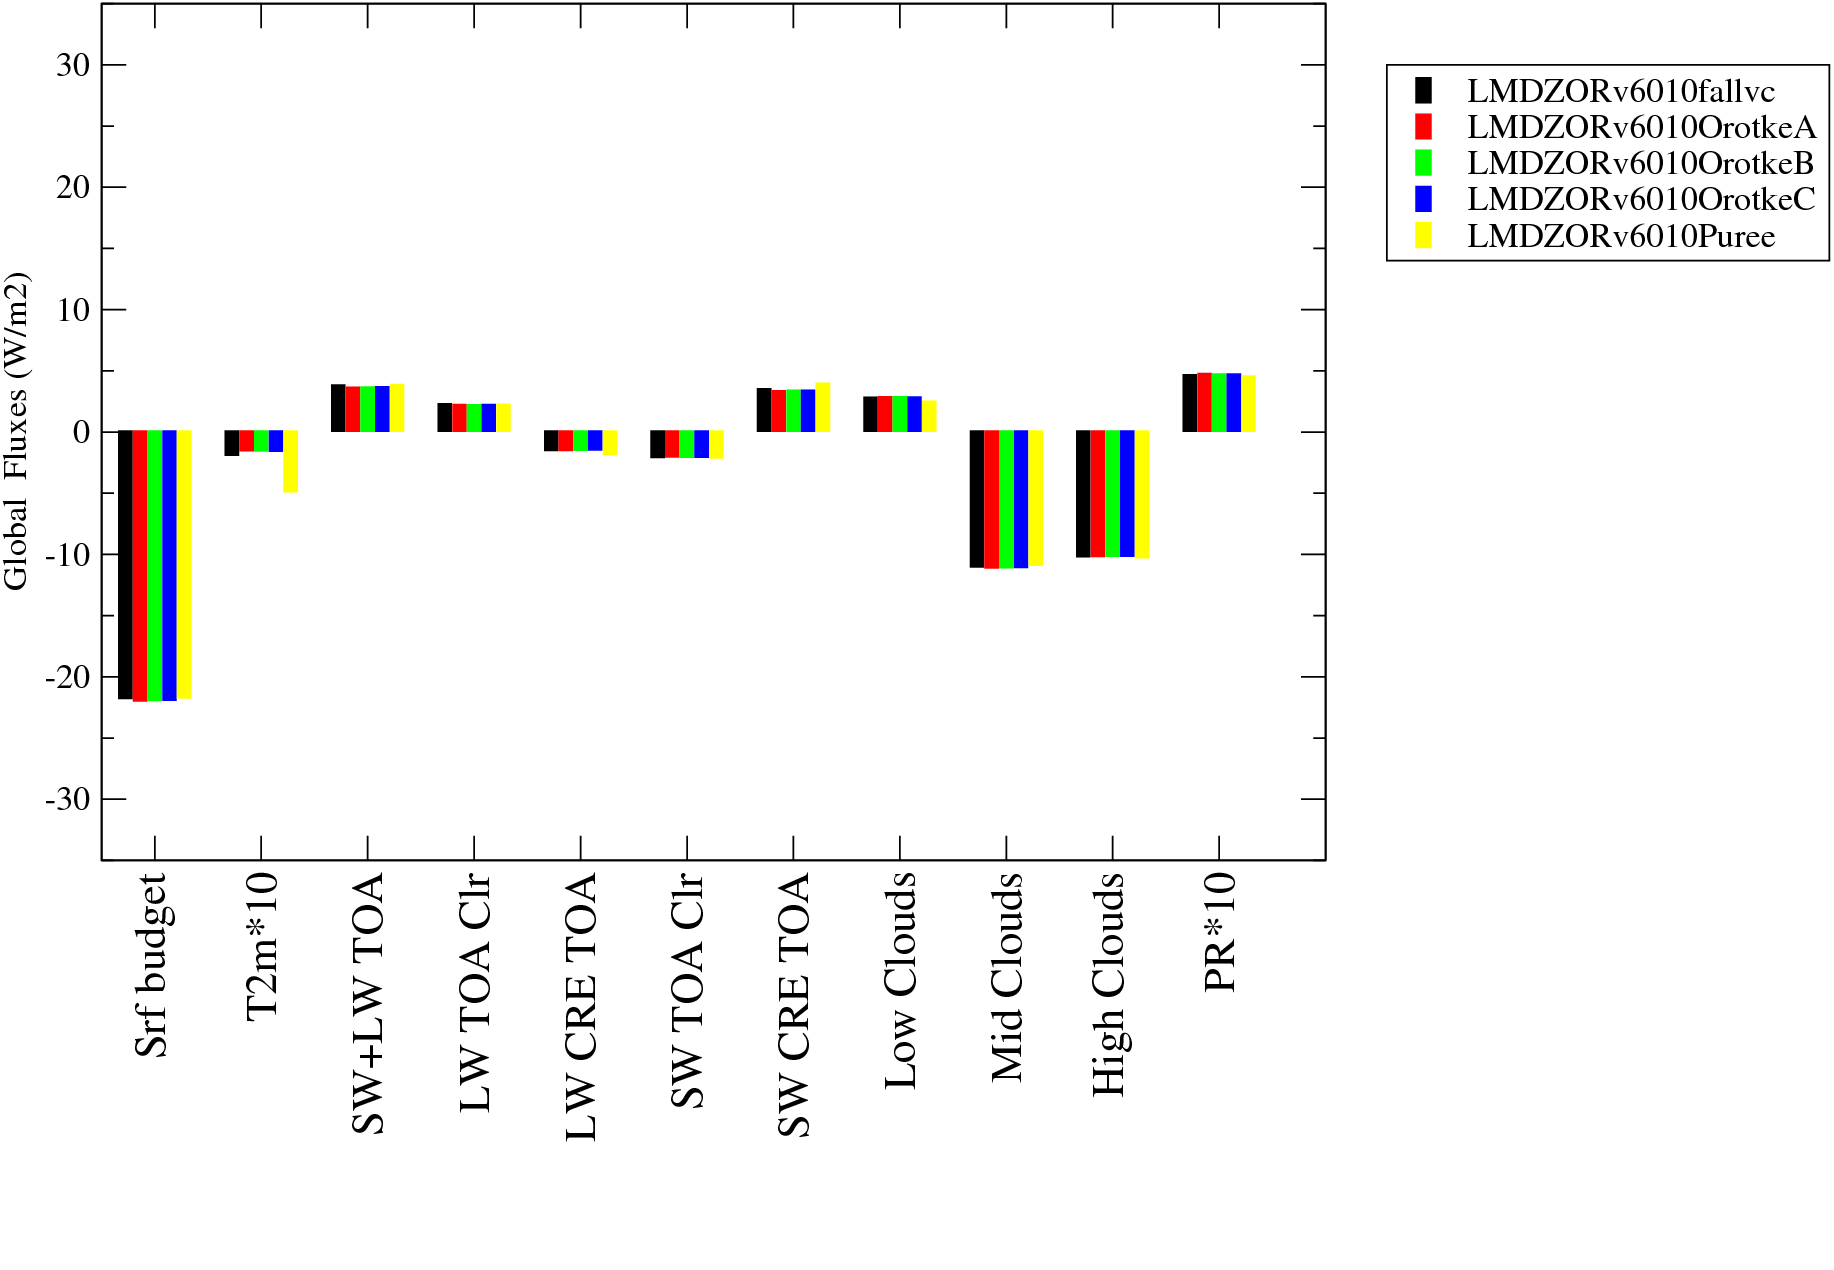
7.097 |
0.7823 |
240.4 |
239.6 |
269.4 |
-47.05 |
29.84 |
-17.21 |
3.415 |
2.61 |
27.46 |
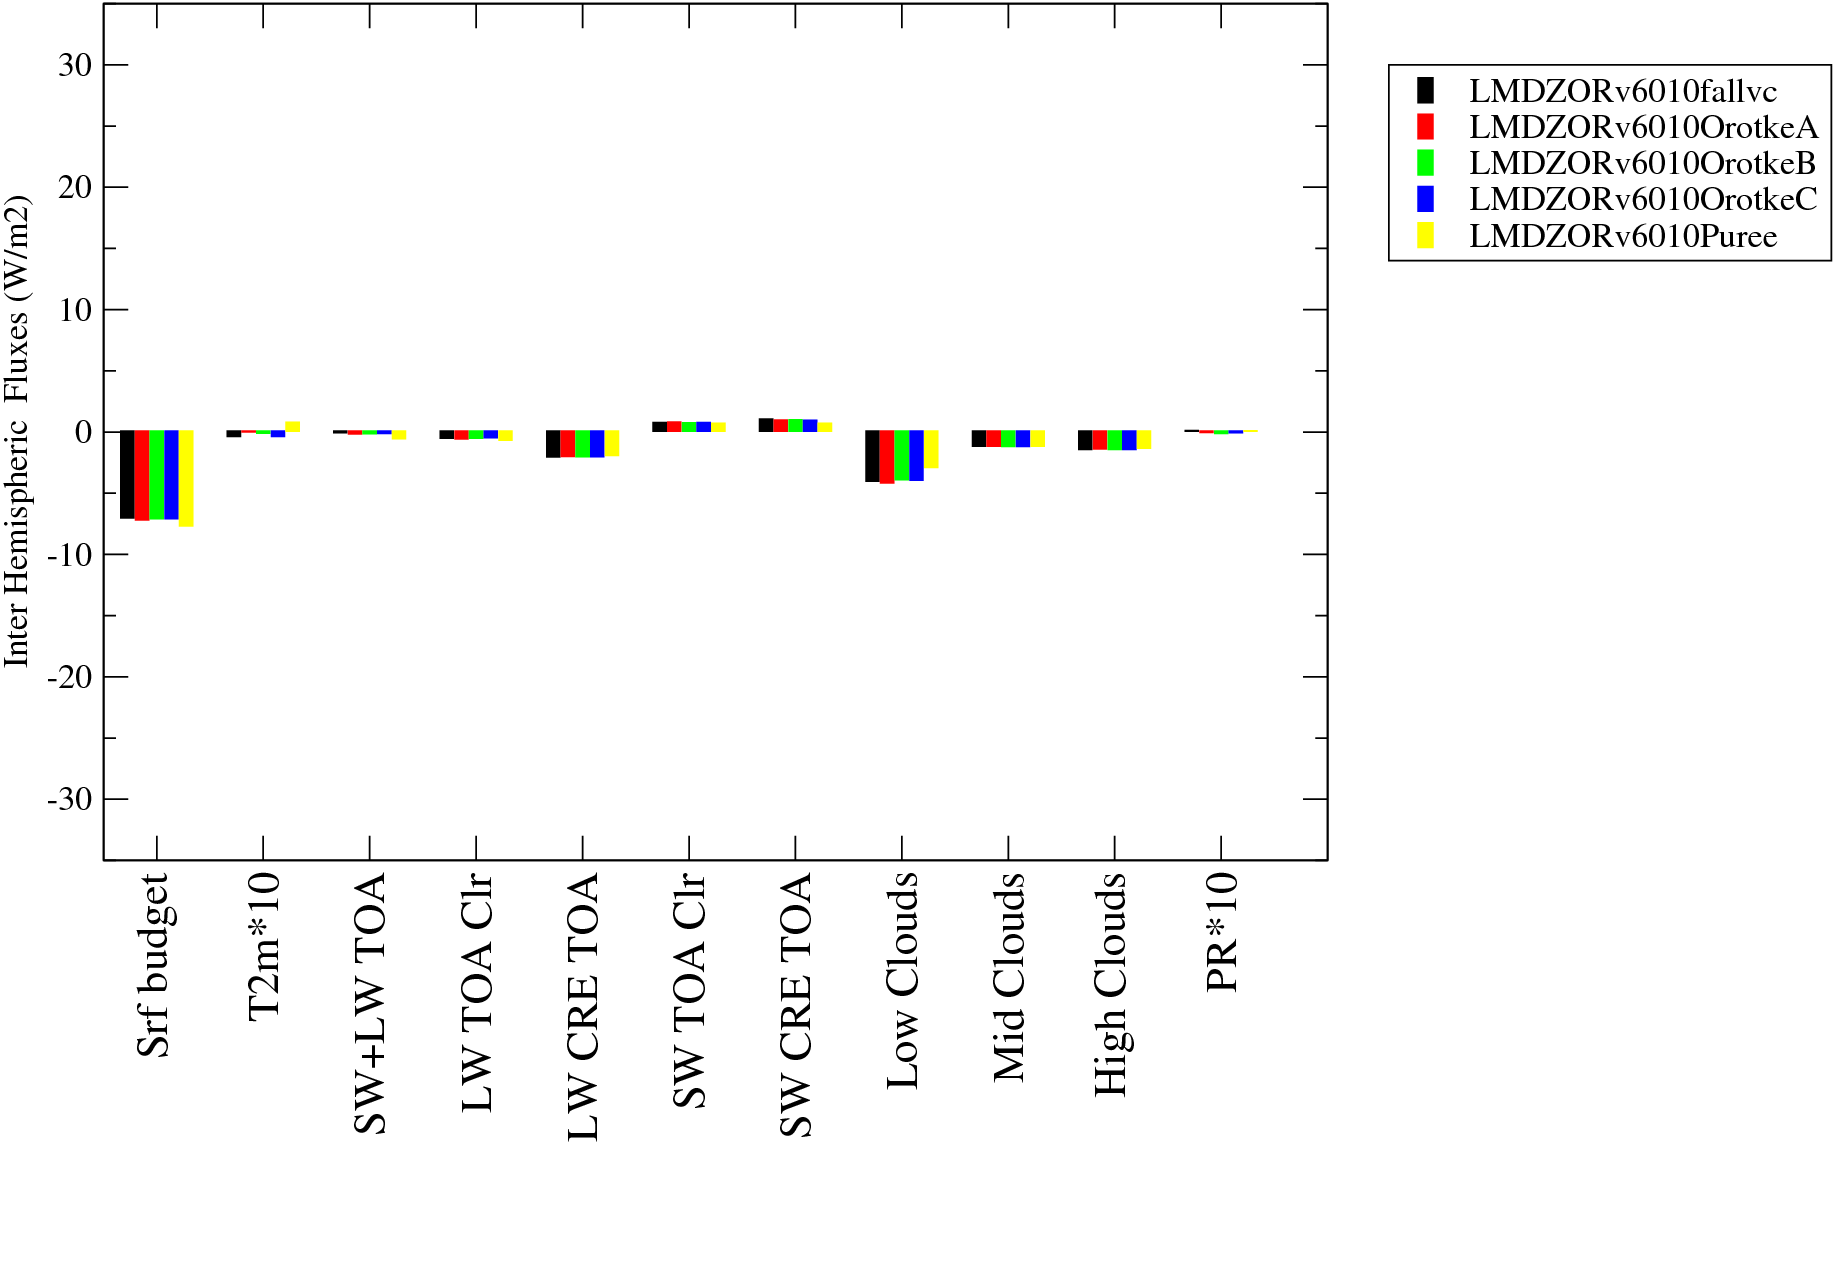
| LMDZORv6010fallvc |
G
-
-
|
G
-
-
|
G
-
-
|
Reglage 6010fallvc |
1980_1999 |
LMDZORv6010fallvc |
5.1909 | 4.6956 | 243.594 | 238.898 | 263.436 | -43.6257 | 24.538 | -19.0877 | | 3.07708 | 25.0864 |
| LMDZORv6010OrotkeA |
G
-
-
|
G
-
-
|
G
-
-
|
6010fallvc,alphatkeoro=1.,addtkeoro=1 |
1980_1999 |
LMDZORv6010OrotkeA |
4.9929 | 4.5057 | 243.447 | 238.941 | 263.489 | -43.8051 | 24.548 | -19.2571 | | 3.08618 | 25.0639 |
| LMDZORv6010OrotkeB |
G
-
-
|
G
-
-
|
G
-
-
|
6010fallvc,alphatkeoro=1.,addtkeoro=2 |
1980_1999 |
LMDZORv6010OrotkeB |
5.0306 | 4.5429 | 243.483 | 238.94 | 263.503 | -43.7474 | 24.563 | -19.1844 | | 3.08328 | 25.0535 |
| LMDZORv6010OrotkeC |
G
-
-
|
G
-
-
|
G
-
-
|
6010fallvc,alphatkeoro=1.,addtkeoro=1,smallscales_tkeoro=y |
1980_1999 |
LMDZORv6010OrotkeC |
5.0419 | 4.5599 | 243.483 | 238.923 | 263.492 | -43.754 | 24.569 | -19.185 | | 3.08244 | 25.0613 |
| LMDZORv6010Puree |
G
-
-
|
G
-
-
|
G
-
-
|
6010fallvc,yamada4_ric=0.18,lmixmin=0. |
1980_1999 |
LMDZORv6010Puree |
5.2228 | 4.7422 | 244 | 239.258 | 263.469 | -43.1759 | 24.211 | -18.9649 | | 3.06614 | 24.875 |