

| RUN | Atlas YEAR | Atlas --DJF-- | Atlas --JJA-- | Description of the simulation _______________________________ | Period | Name | bils | rt | rst | rlut | rlutcs | crest | crelt | cret | eva | pr | prw |
| CLIMATOS | 7.097 | 0.7823 | 240.4 | 239.6 | 269.4 | -47.05 | 29.84 | -17.21 | 3.415 | 2.61 | 27.46 | ||||||
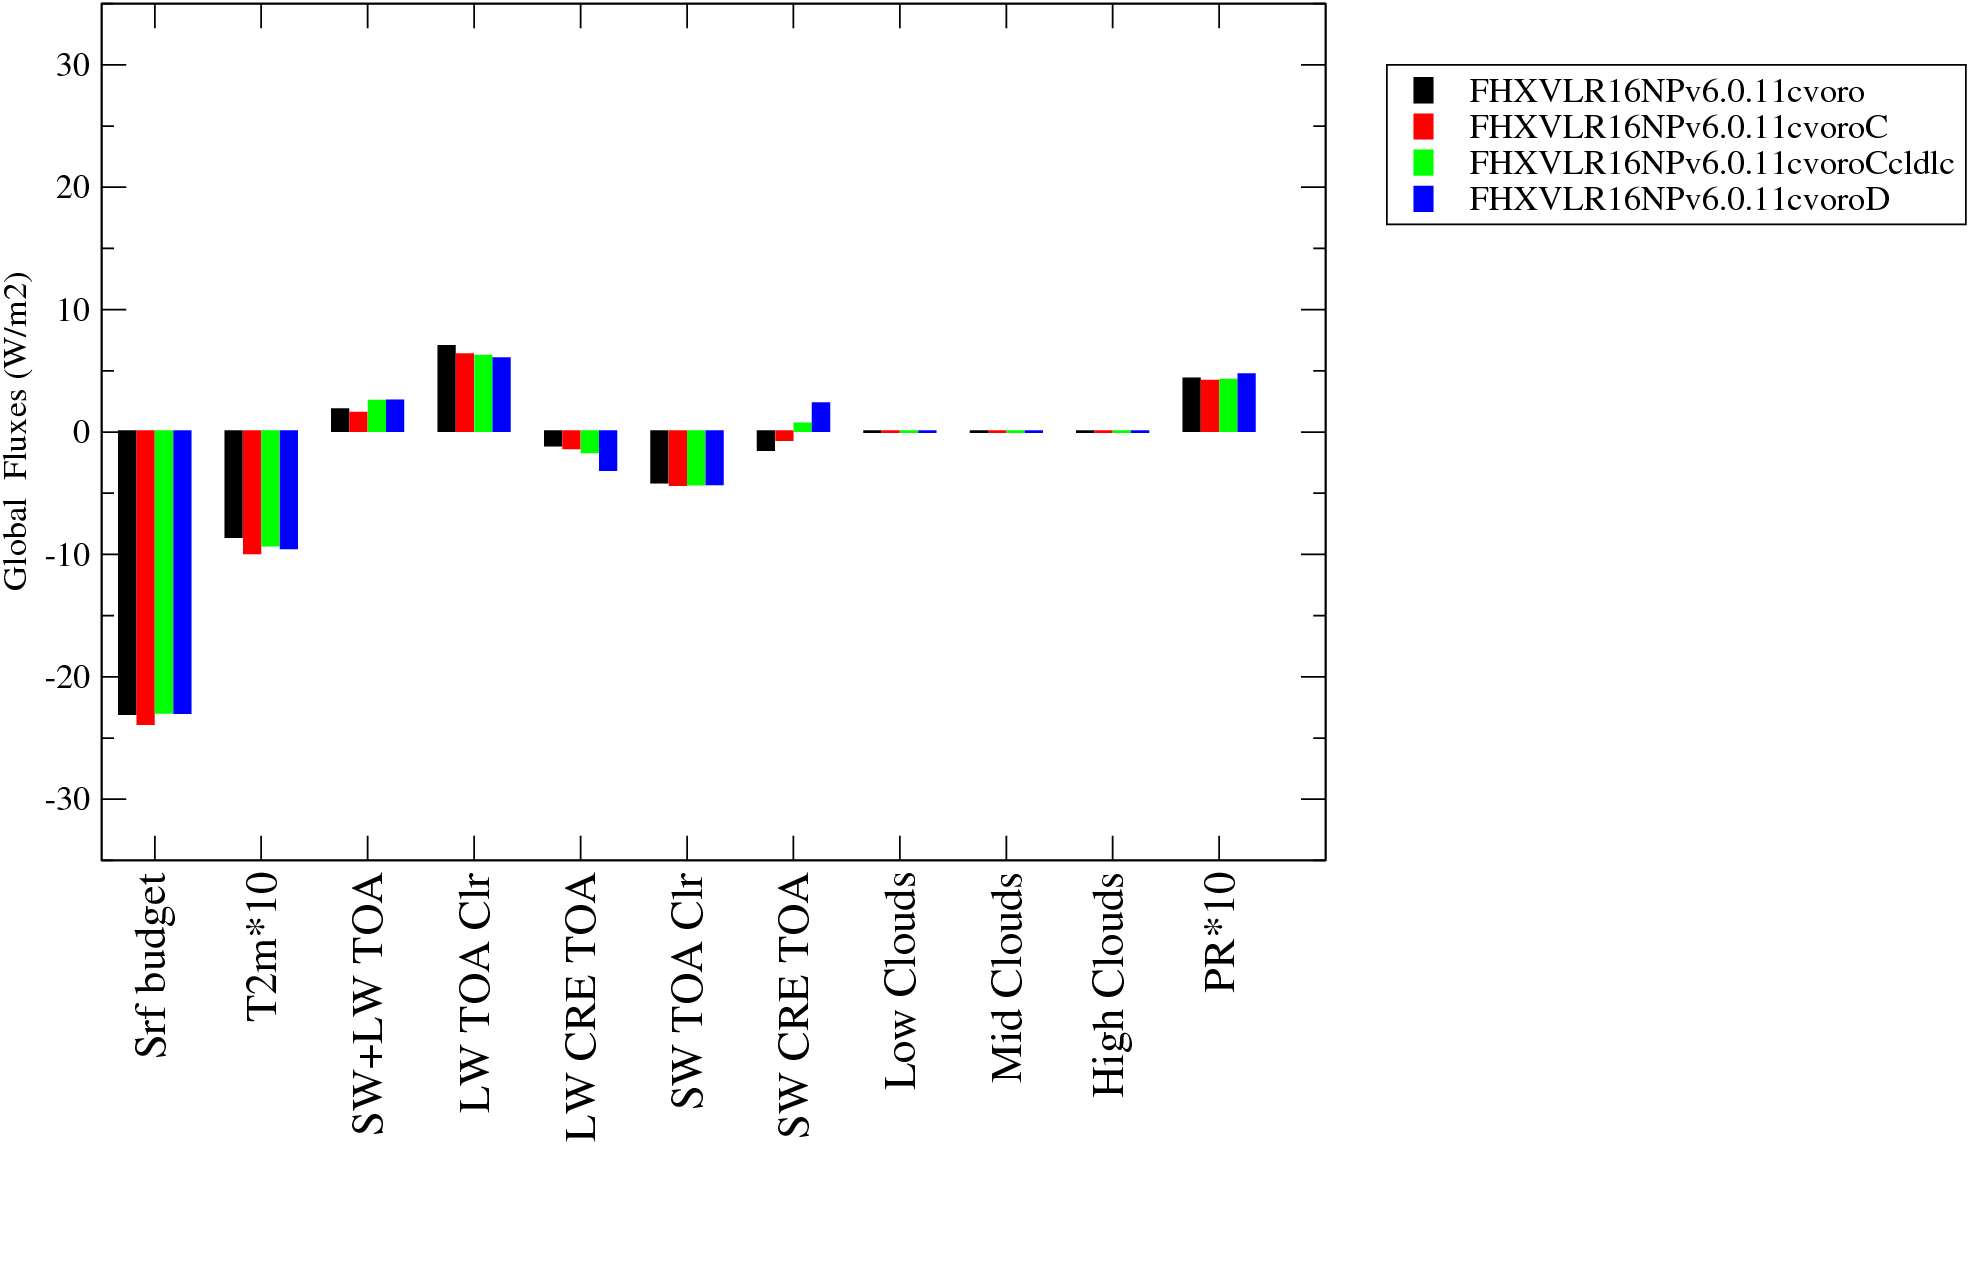
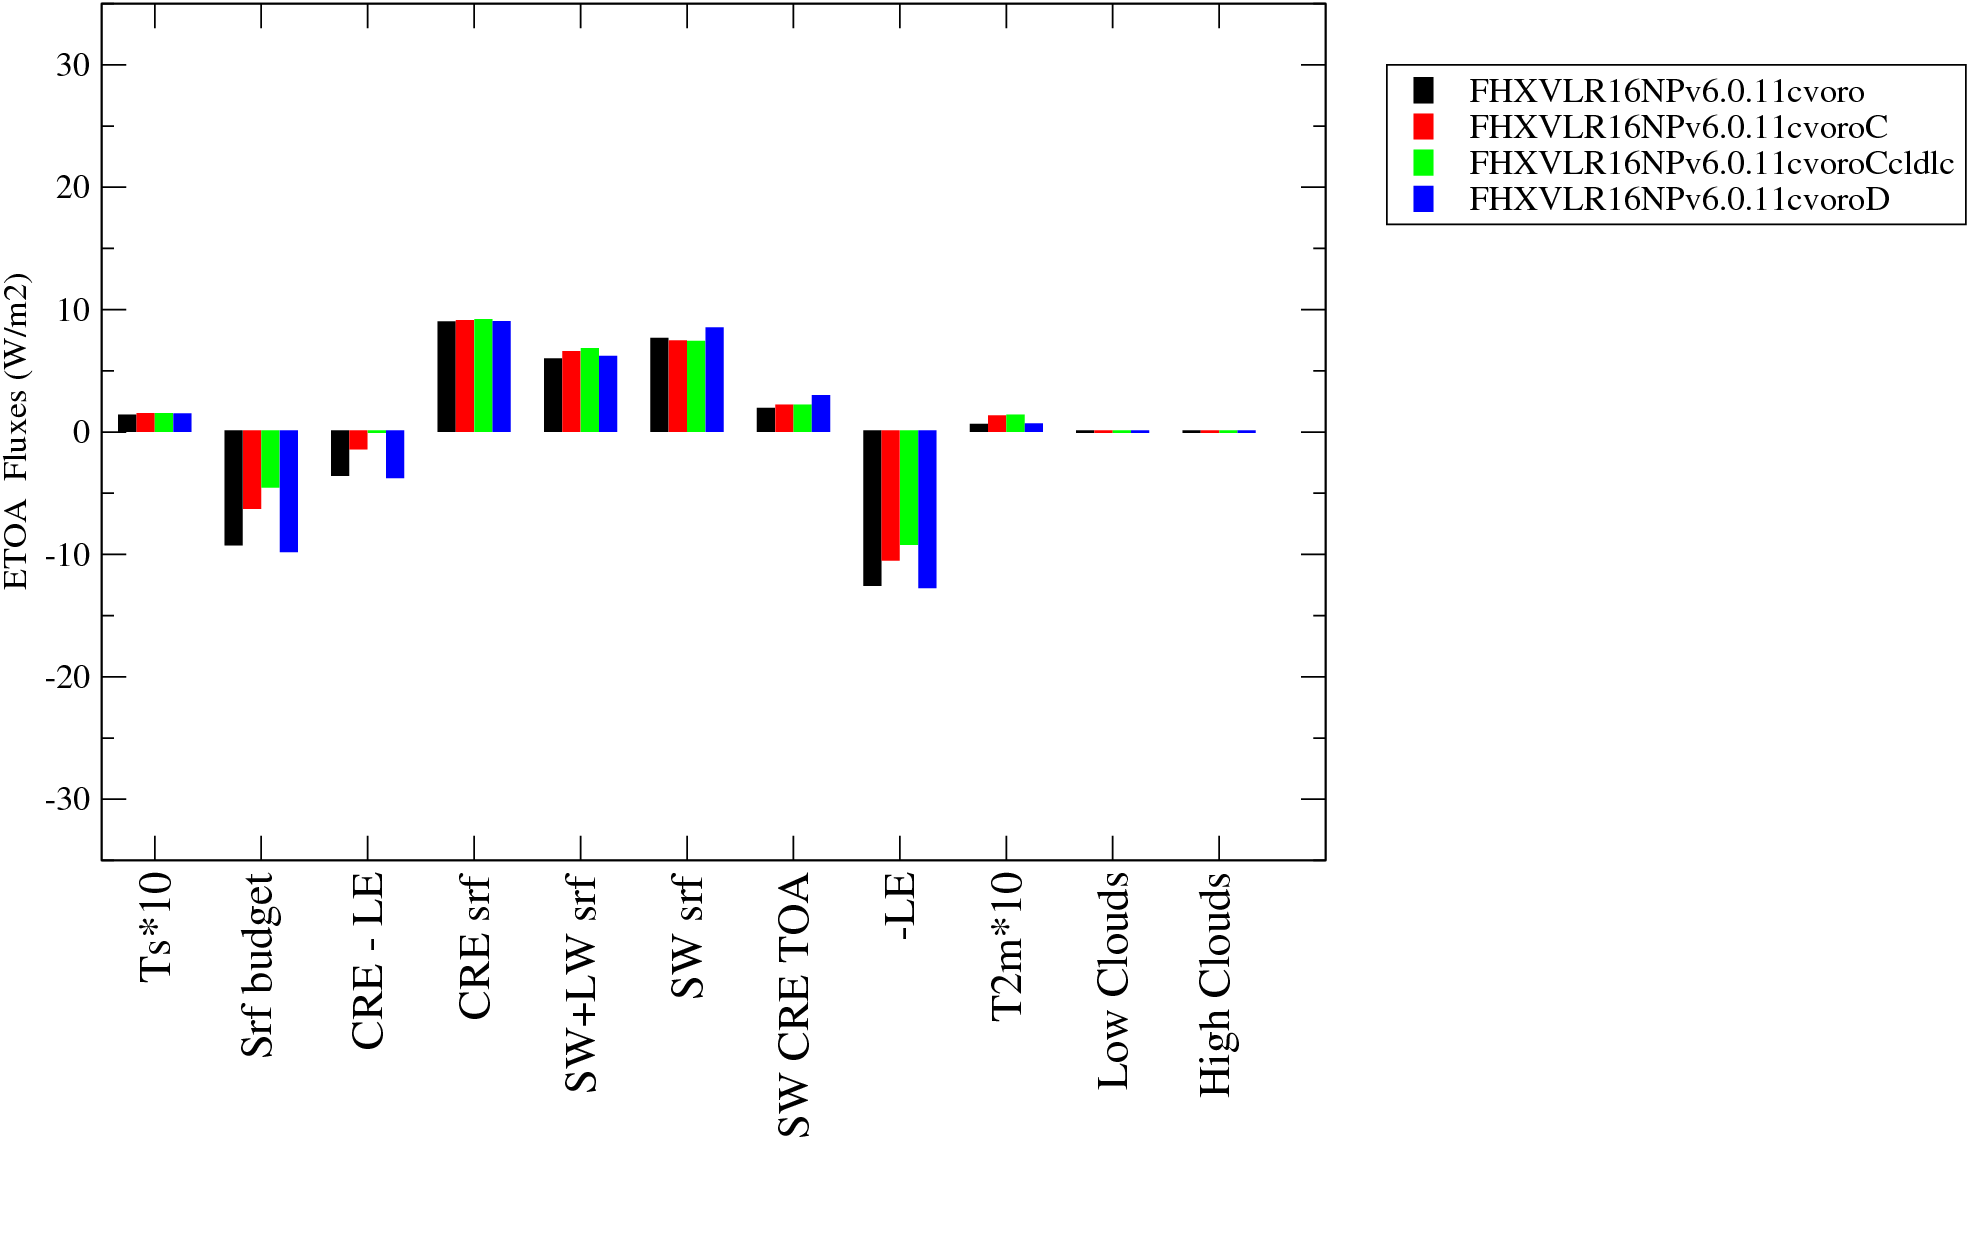
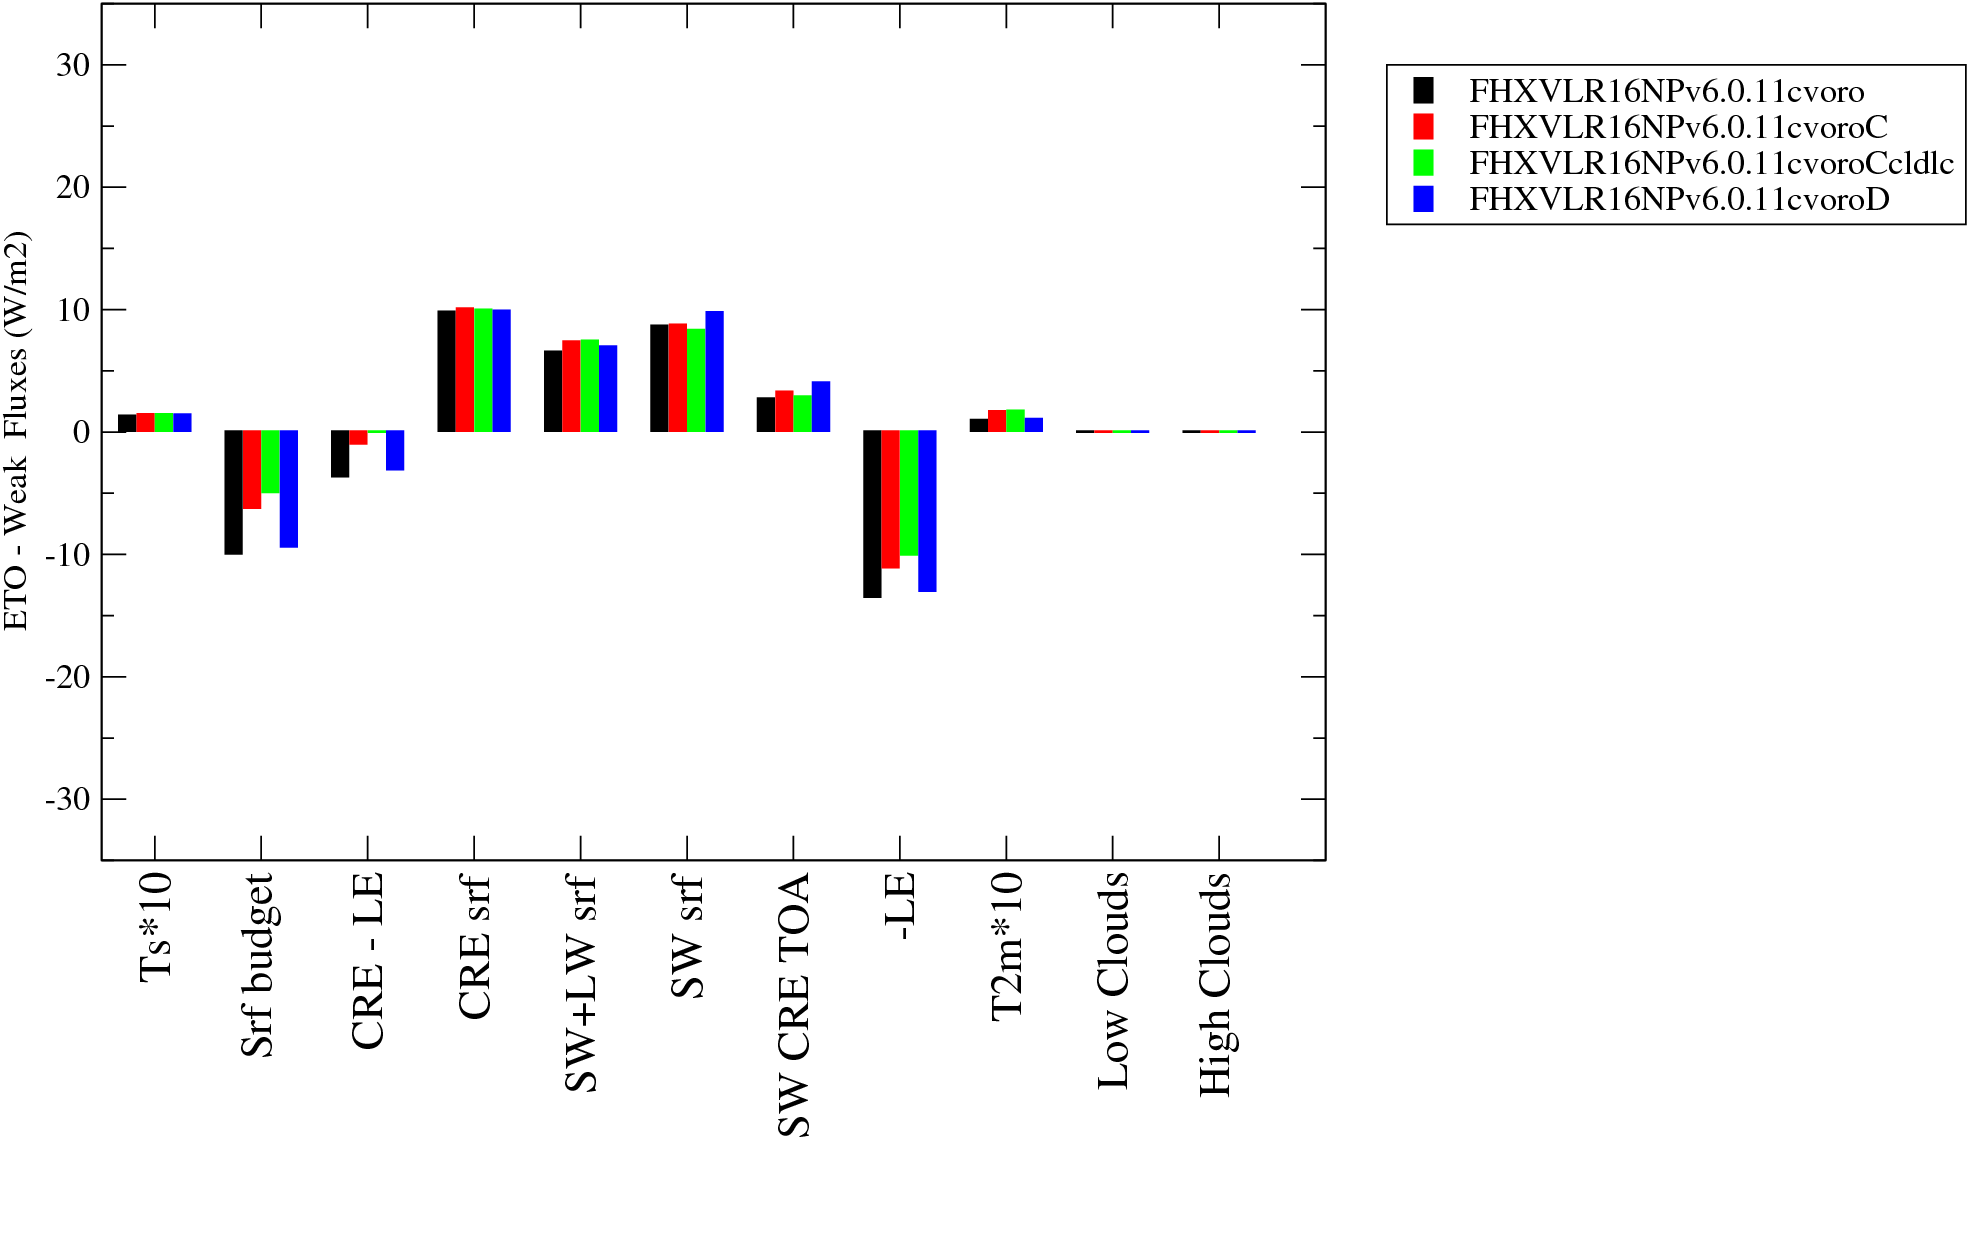
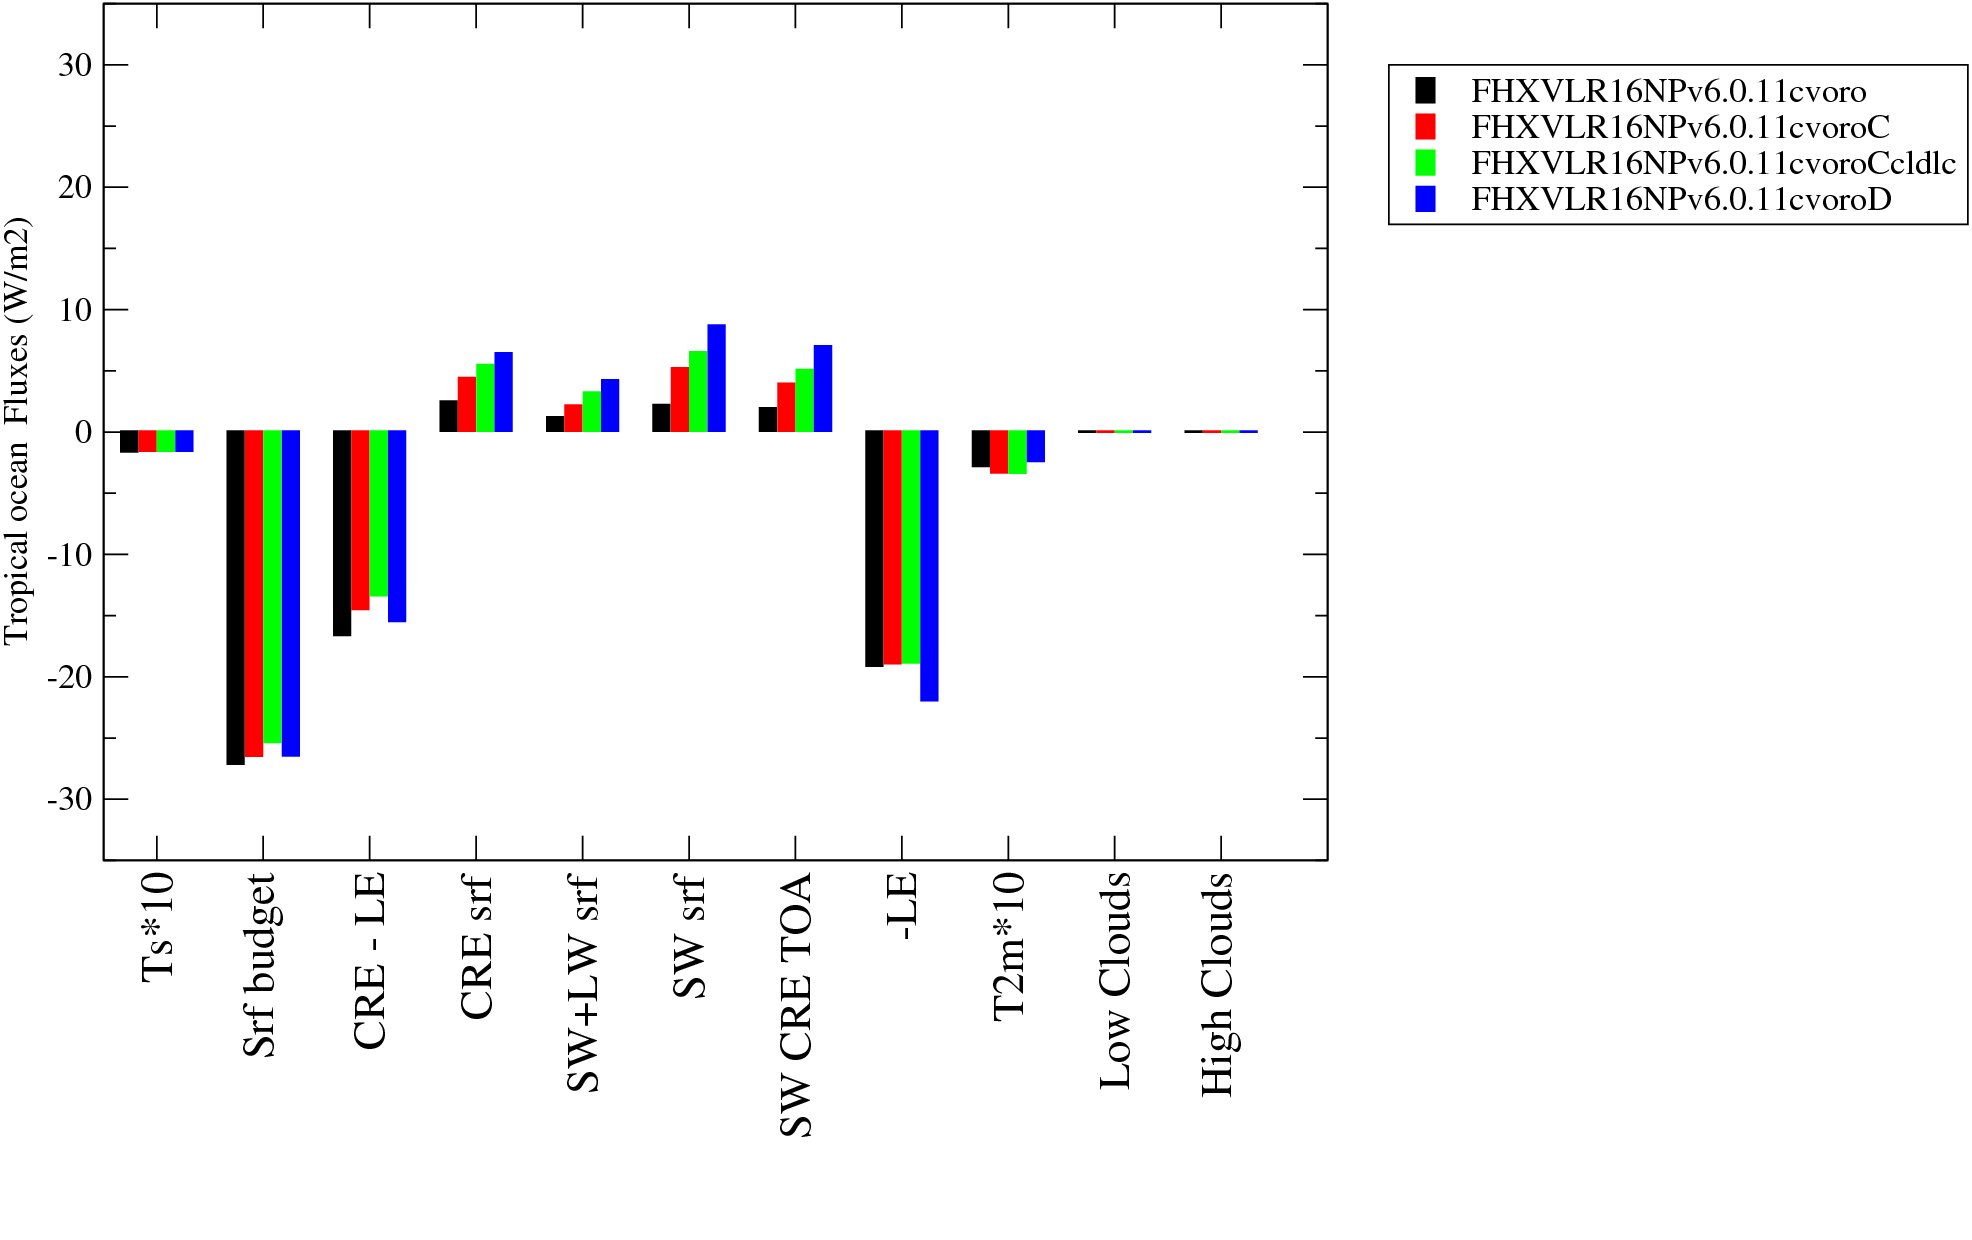
| FHXVLR16NPv6.0.11cvoro | - - - | - - - | - - - | FHXXVLR16NPv6.0.11cvoro | 2006_2006 | FHXVLR16NPv6.0.11cvoro | 3.9209 | 2.738 | 236.498 | 233.76 | 258.681 | -48.6367 | 24.921 | -23.7157 | 3.04828 | 25.9592 | |
| FHXVLR16NPv6.0.11cvoroC | - - - | - - - | - - - | FHXVLR16NPv6.0.11cvoroC | 2006_2006 | FHXVLR16NPv6.0.11cvoroC | 3.0936 | 2.454 | 237.114 | 234.66 | 259.359 | -47.8213 | 24.699 | -23.1223 | 3.02969 | 25.4475 | |
| FHXVLR16NPv6.0.11cvoroCcldlc | - - - | - - - | - - - | FHXVLR16NPv6.0.11cvoroCcldlc | 2006_2006 | FHXVLR16NPv6.0.11cvoroCcldlc | 4.0096 | 3.436 | 238.534 | 235.098 | 259.483 | -46.4574 | 24.385 | -22.0724 | 3.03814 | 25.4887 | |
| FHXVLR16NPv6.0.11cvoroD | - - - | - - - | - - - | FHXVLR16NPv6.0.11cvoroD | 2006_2006 | FHXVLR16NPv6.0.11cvoroD | 3.9963 | 3.46 | 240.214 | 236.754 | 259.692 | -44.7974 | 22.938 | -21.8594 | 3.08263 | 25.1743 | |
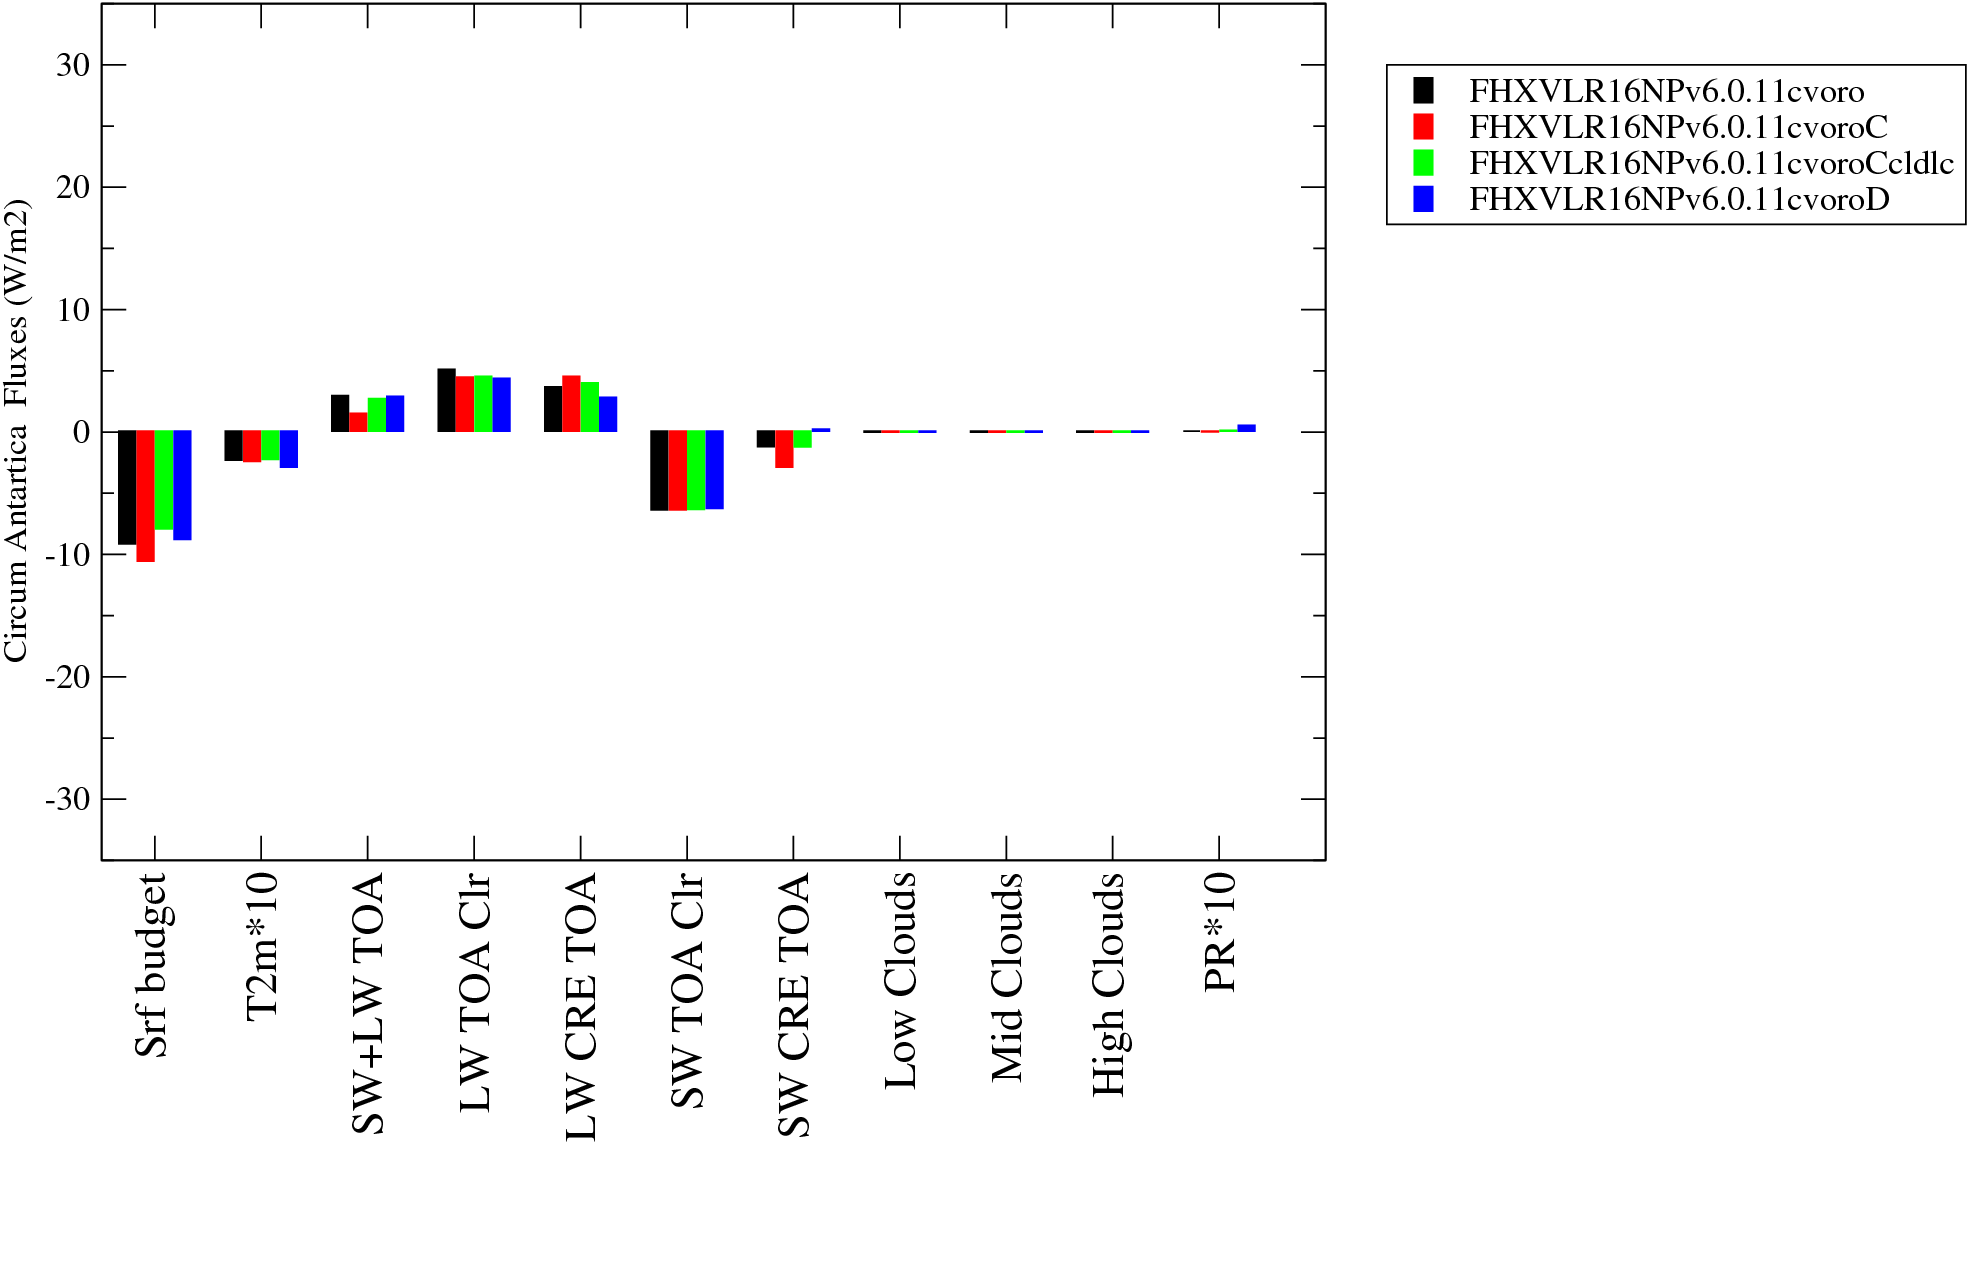
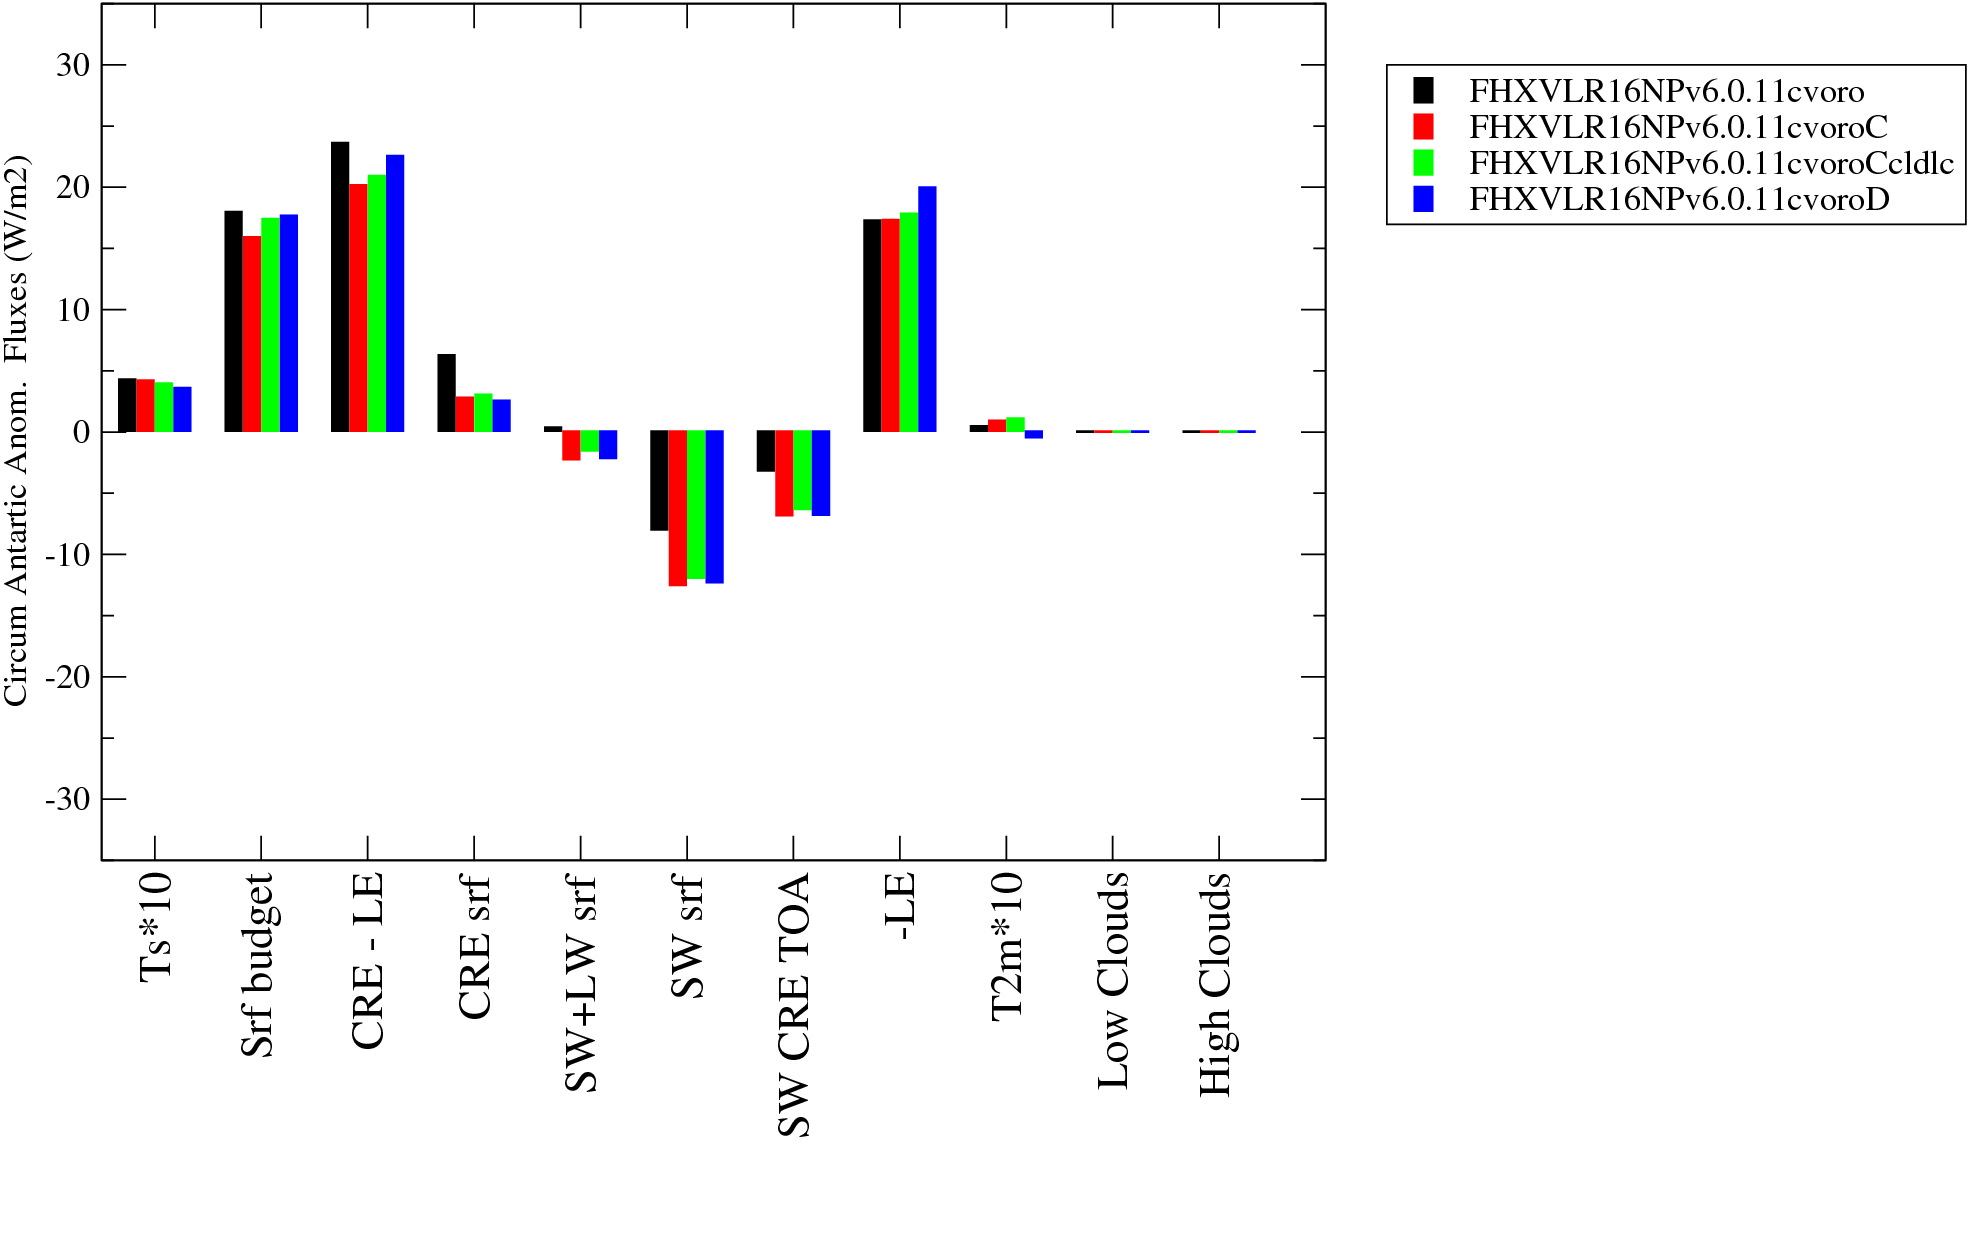
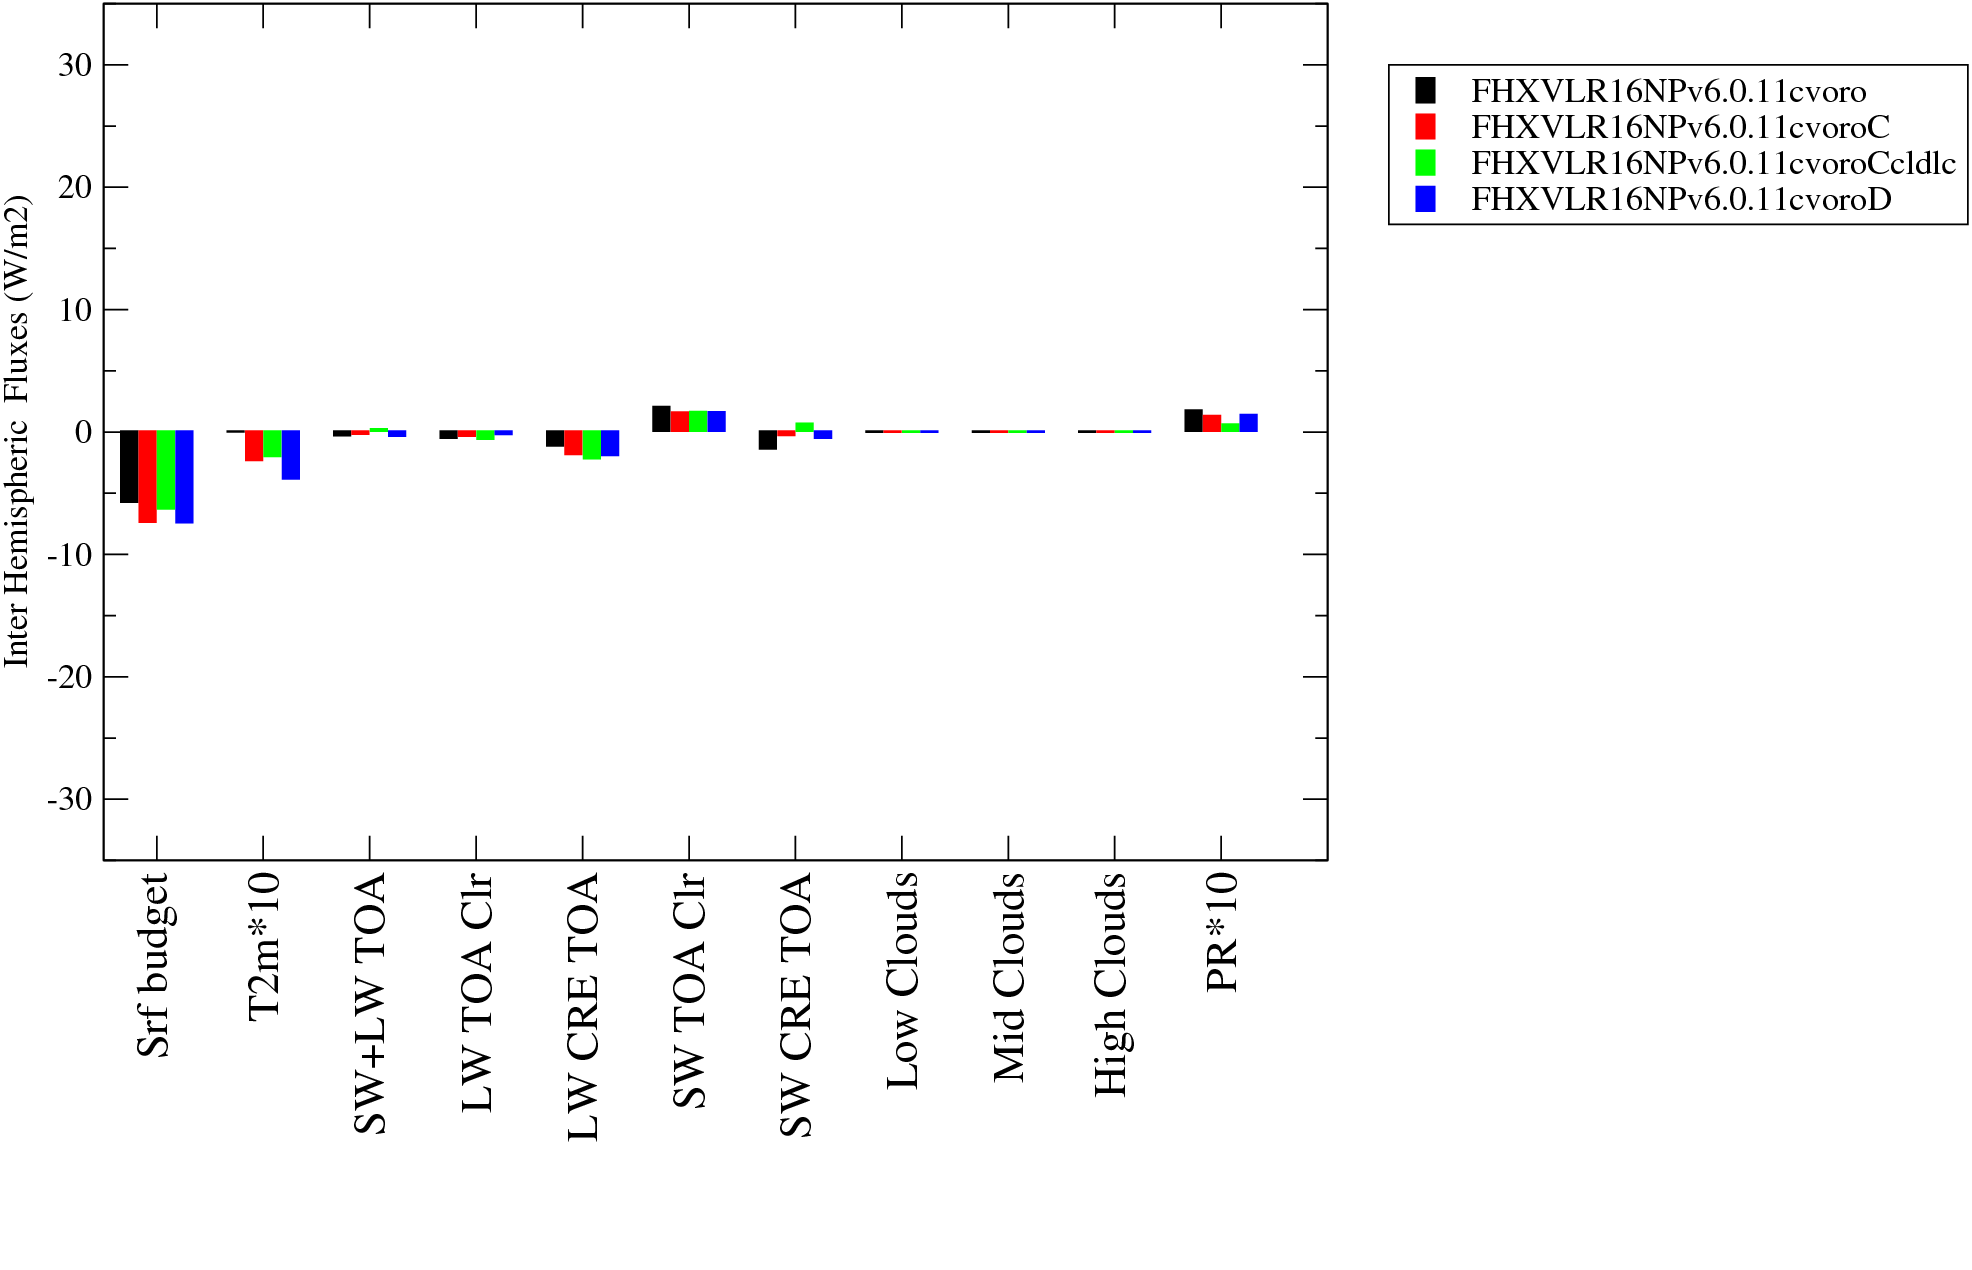
| Global | Circum. Antart | Circum. Antart anom | Inter Hemispheric |
|
|
|
|
|
|
|
|
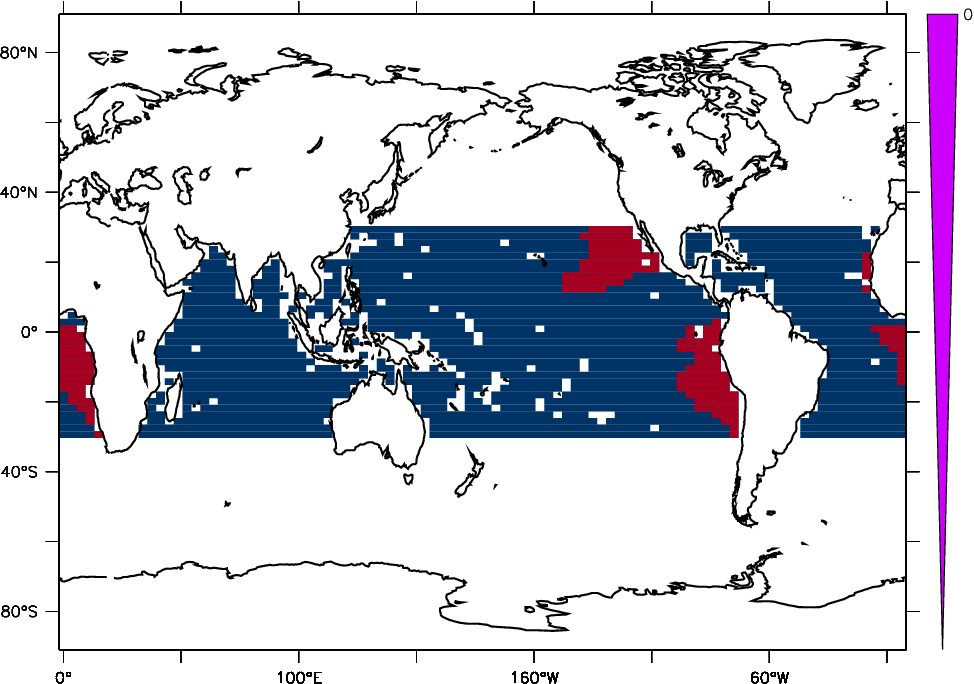
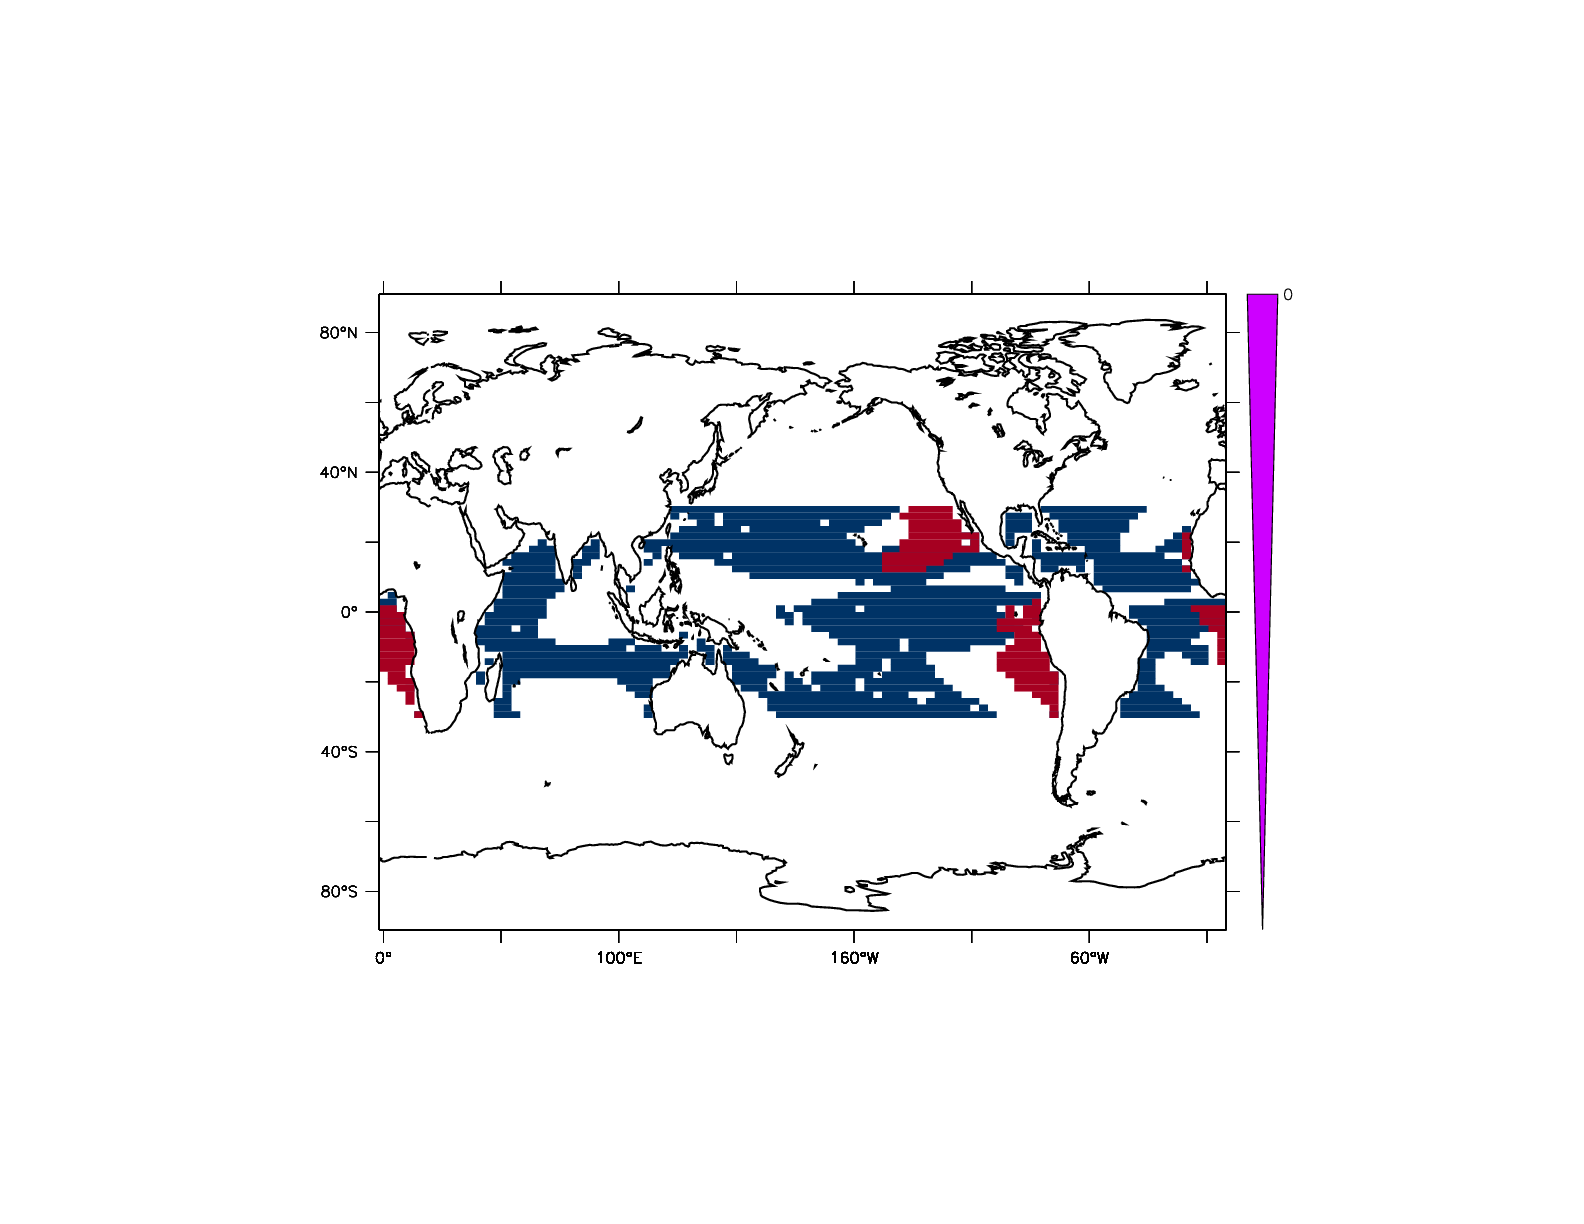
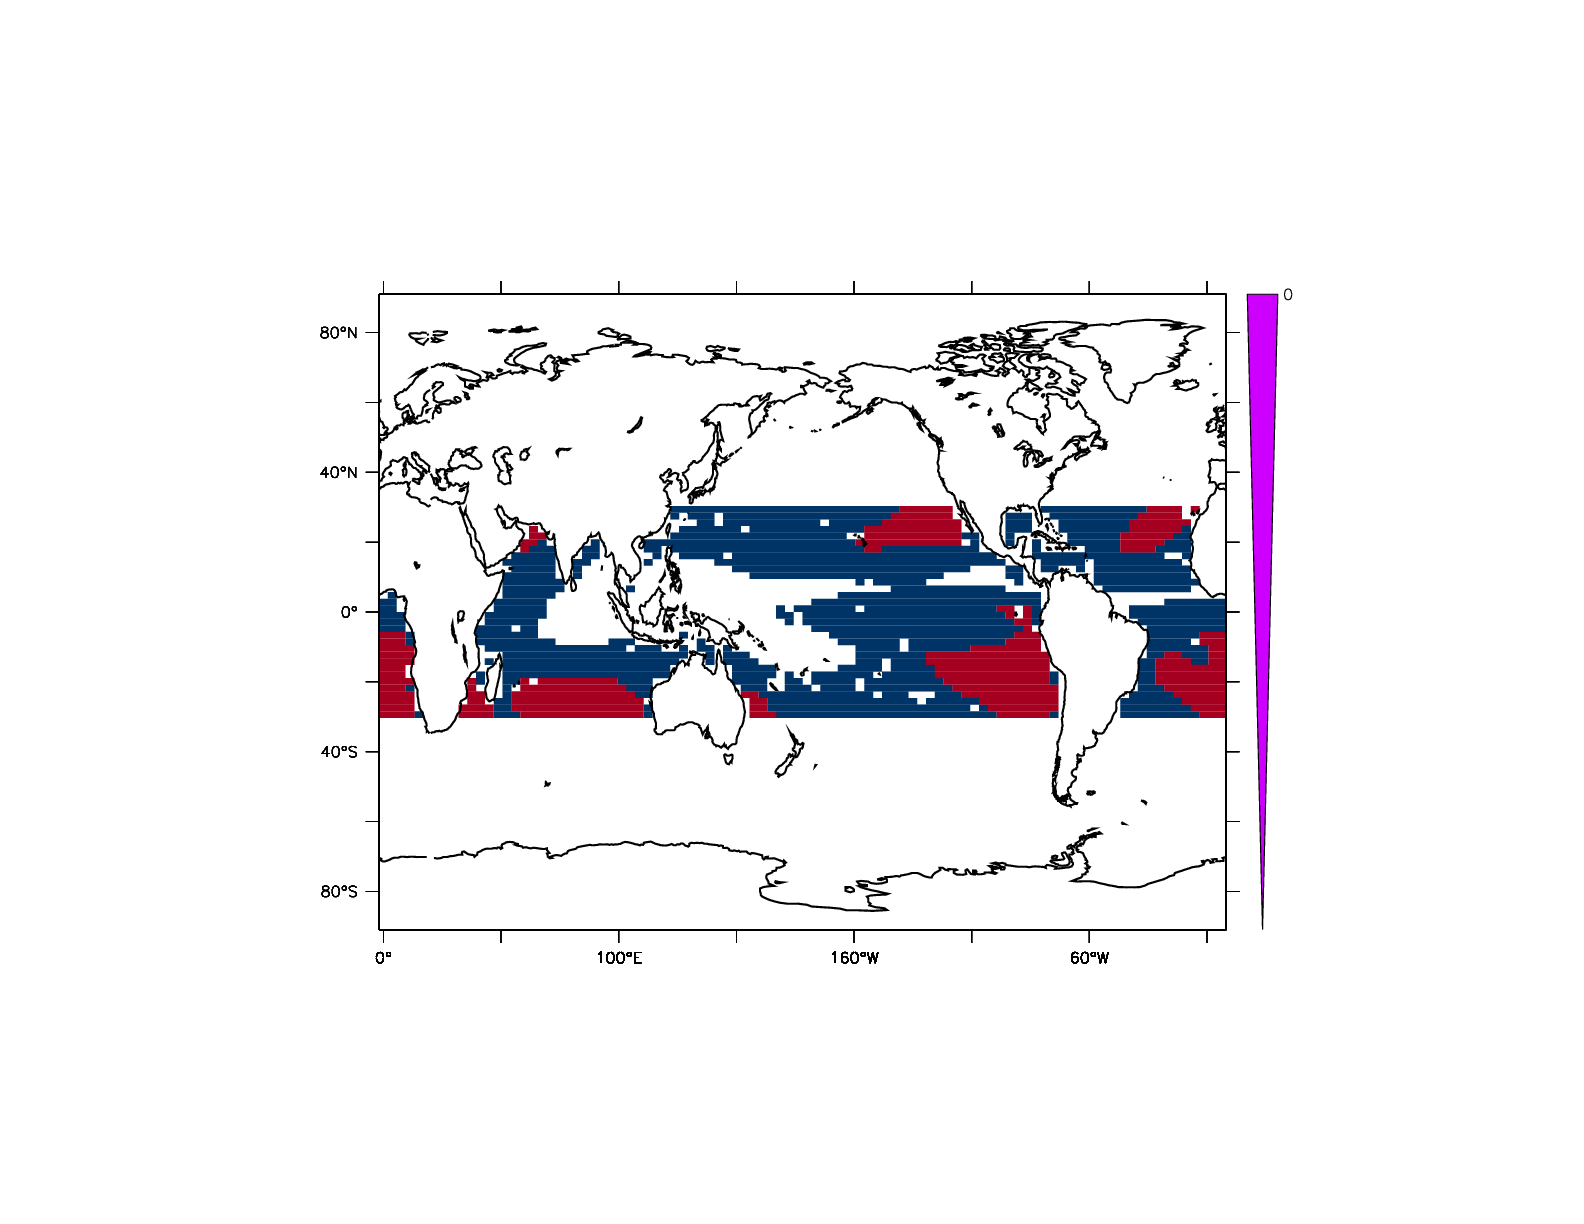
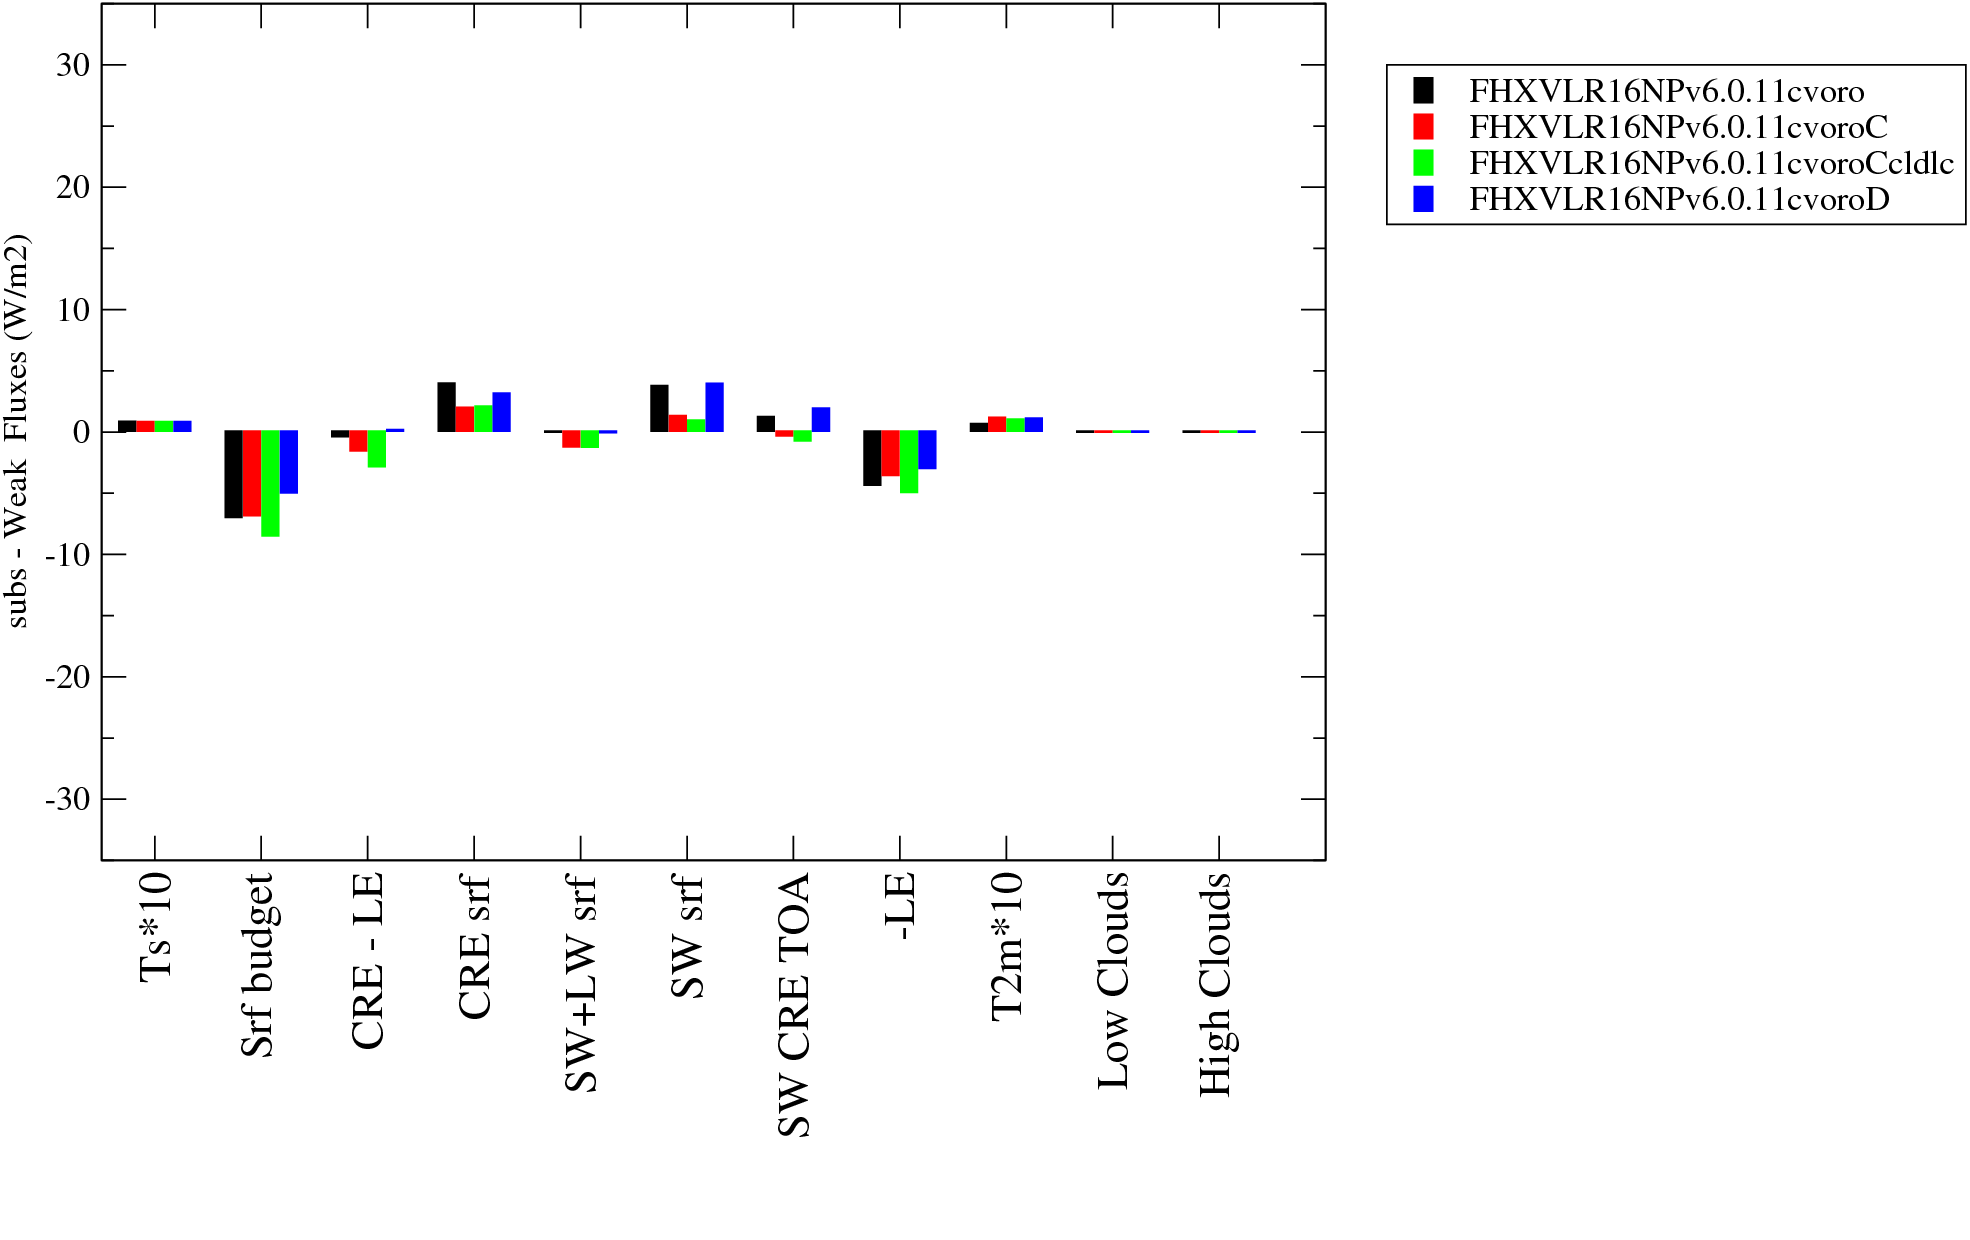
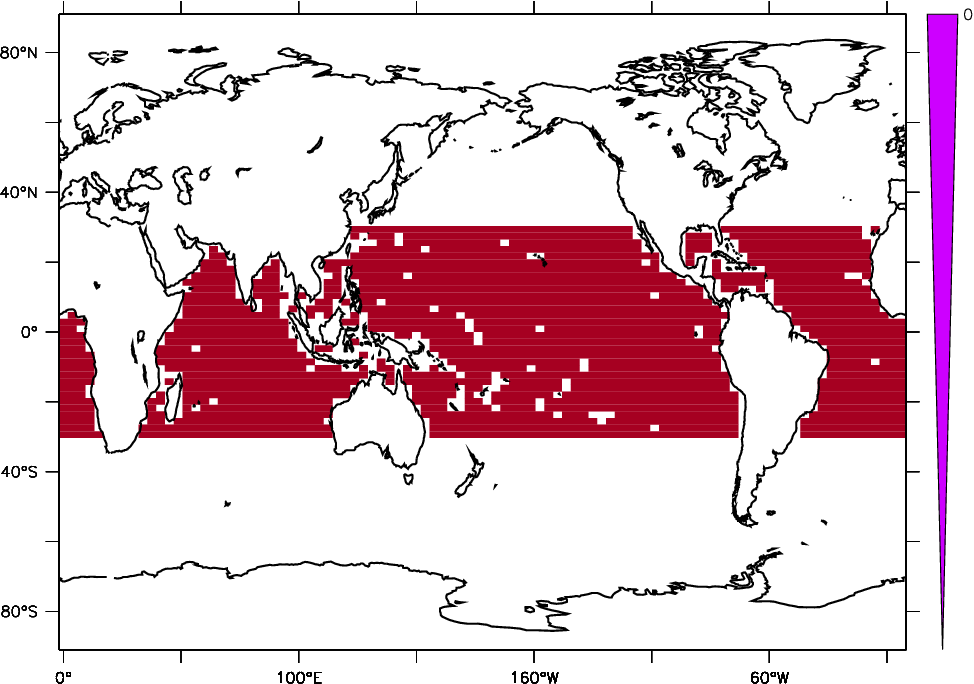
| East Tropic Ocean Anom. (ETOA) | ETO anom : ETO - WEAK | ETO anom : SUBS - WEAK | |
|
|
|
|
|
|
|
|
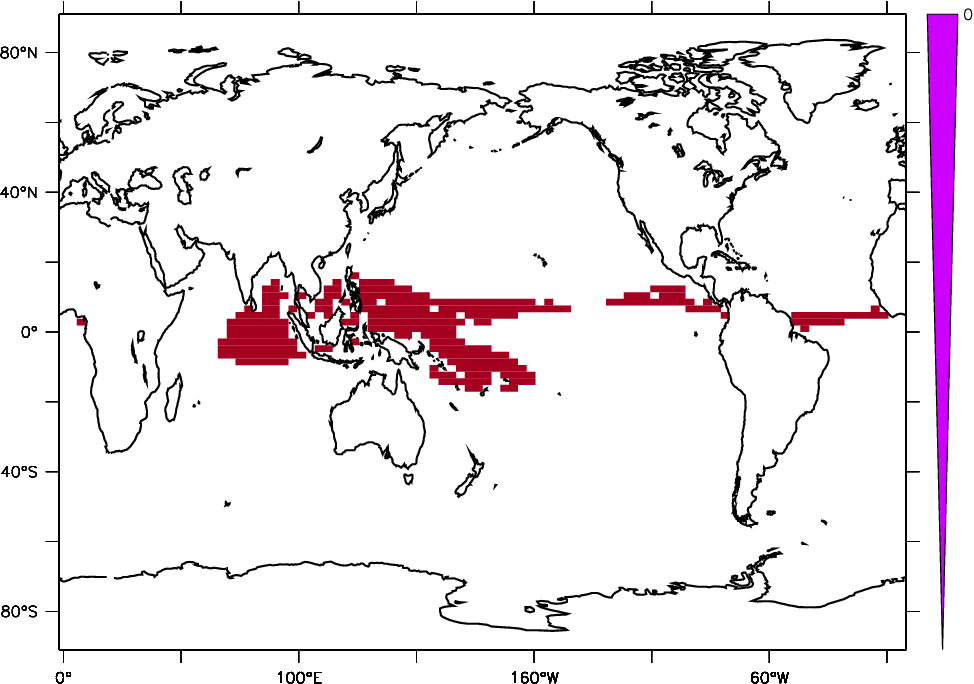
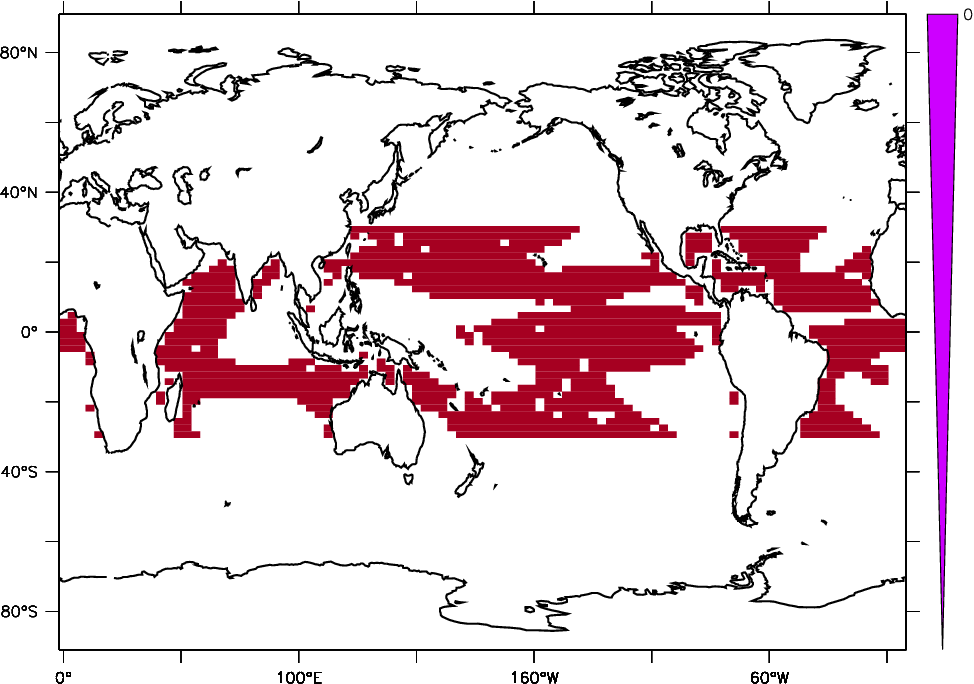
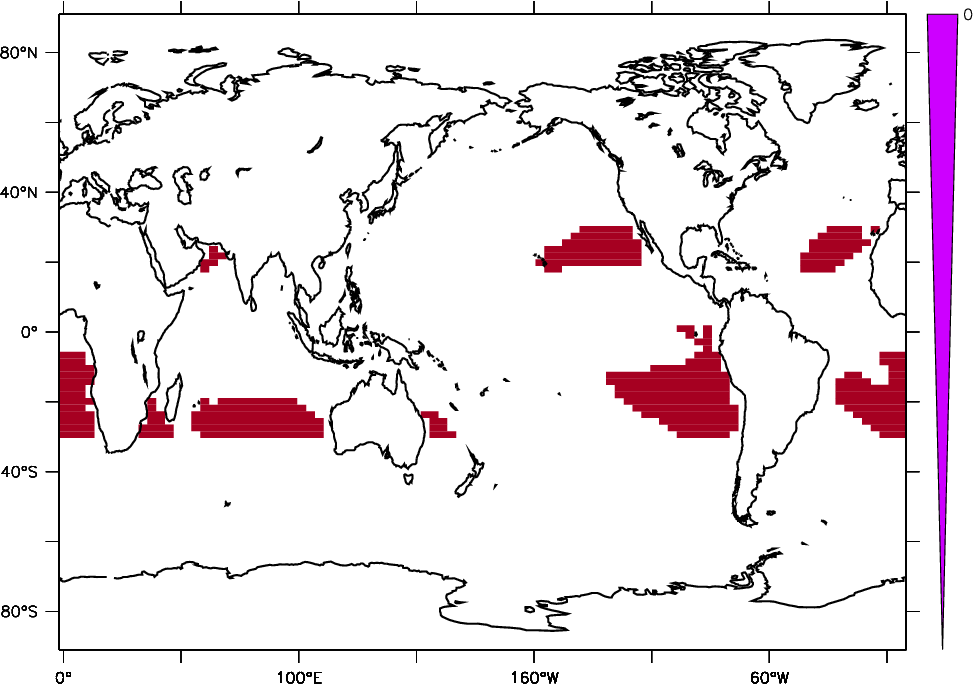
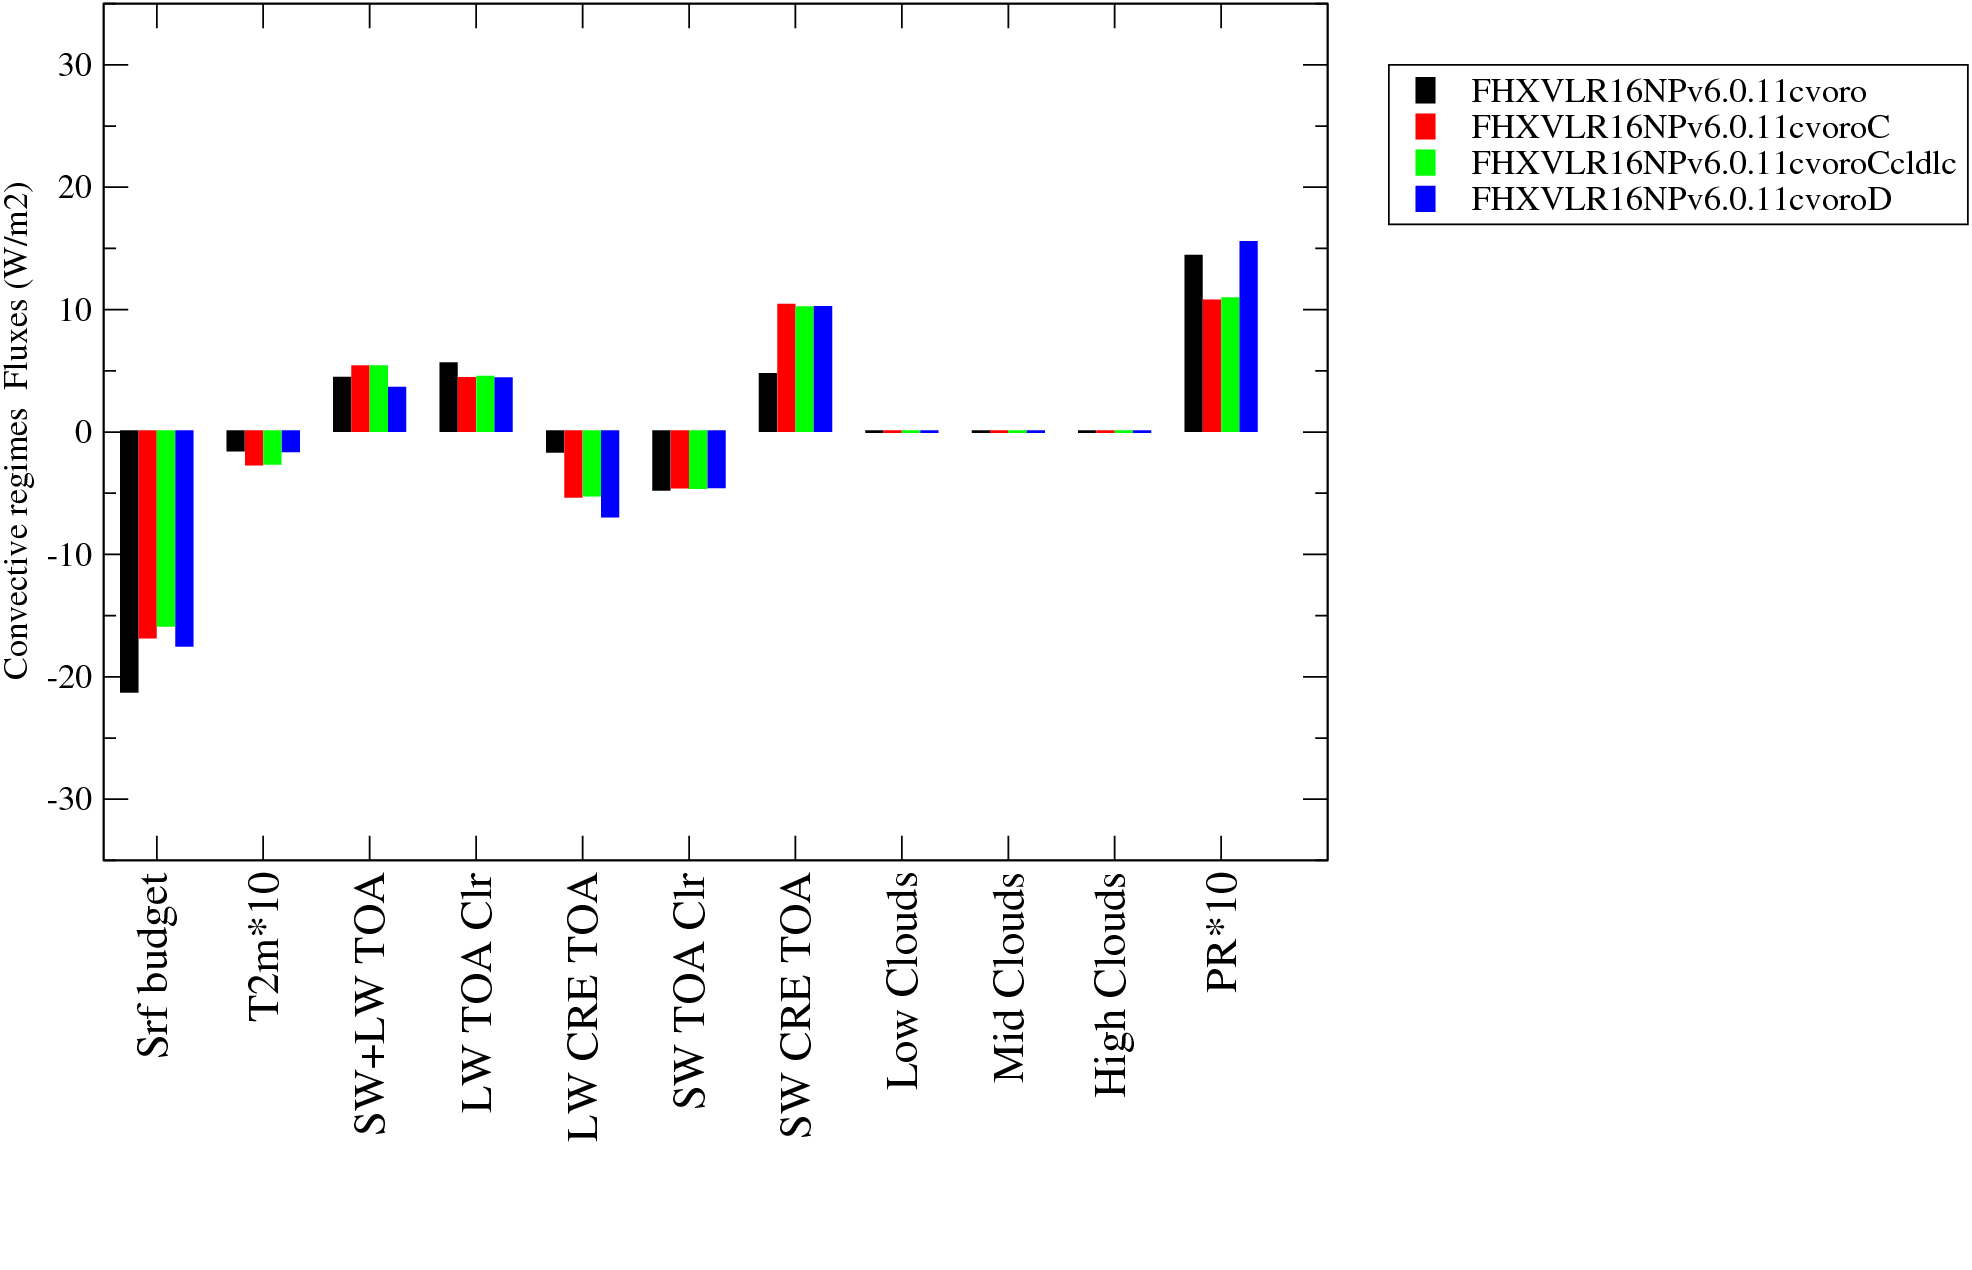
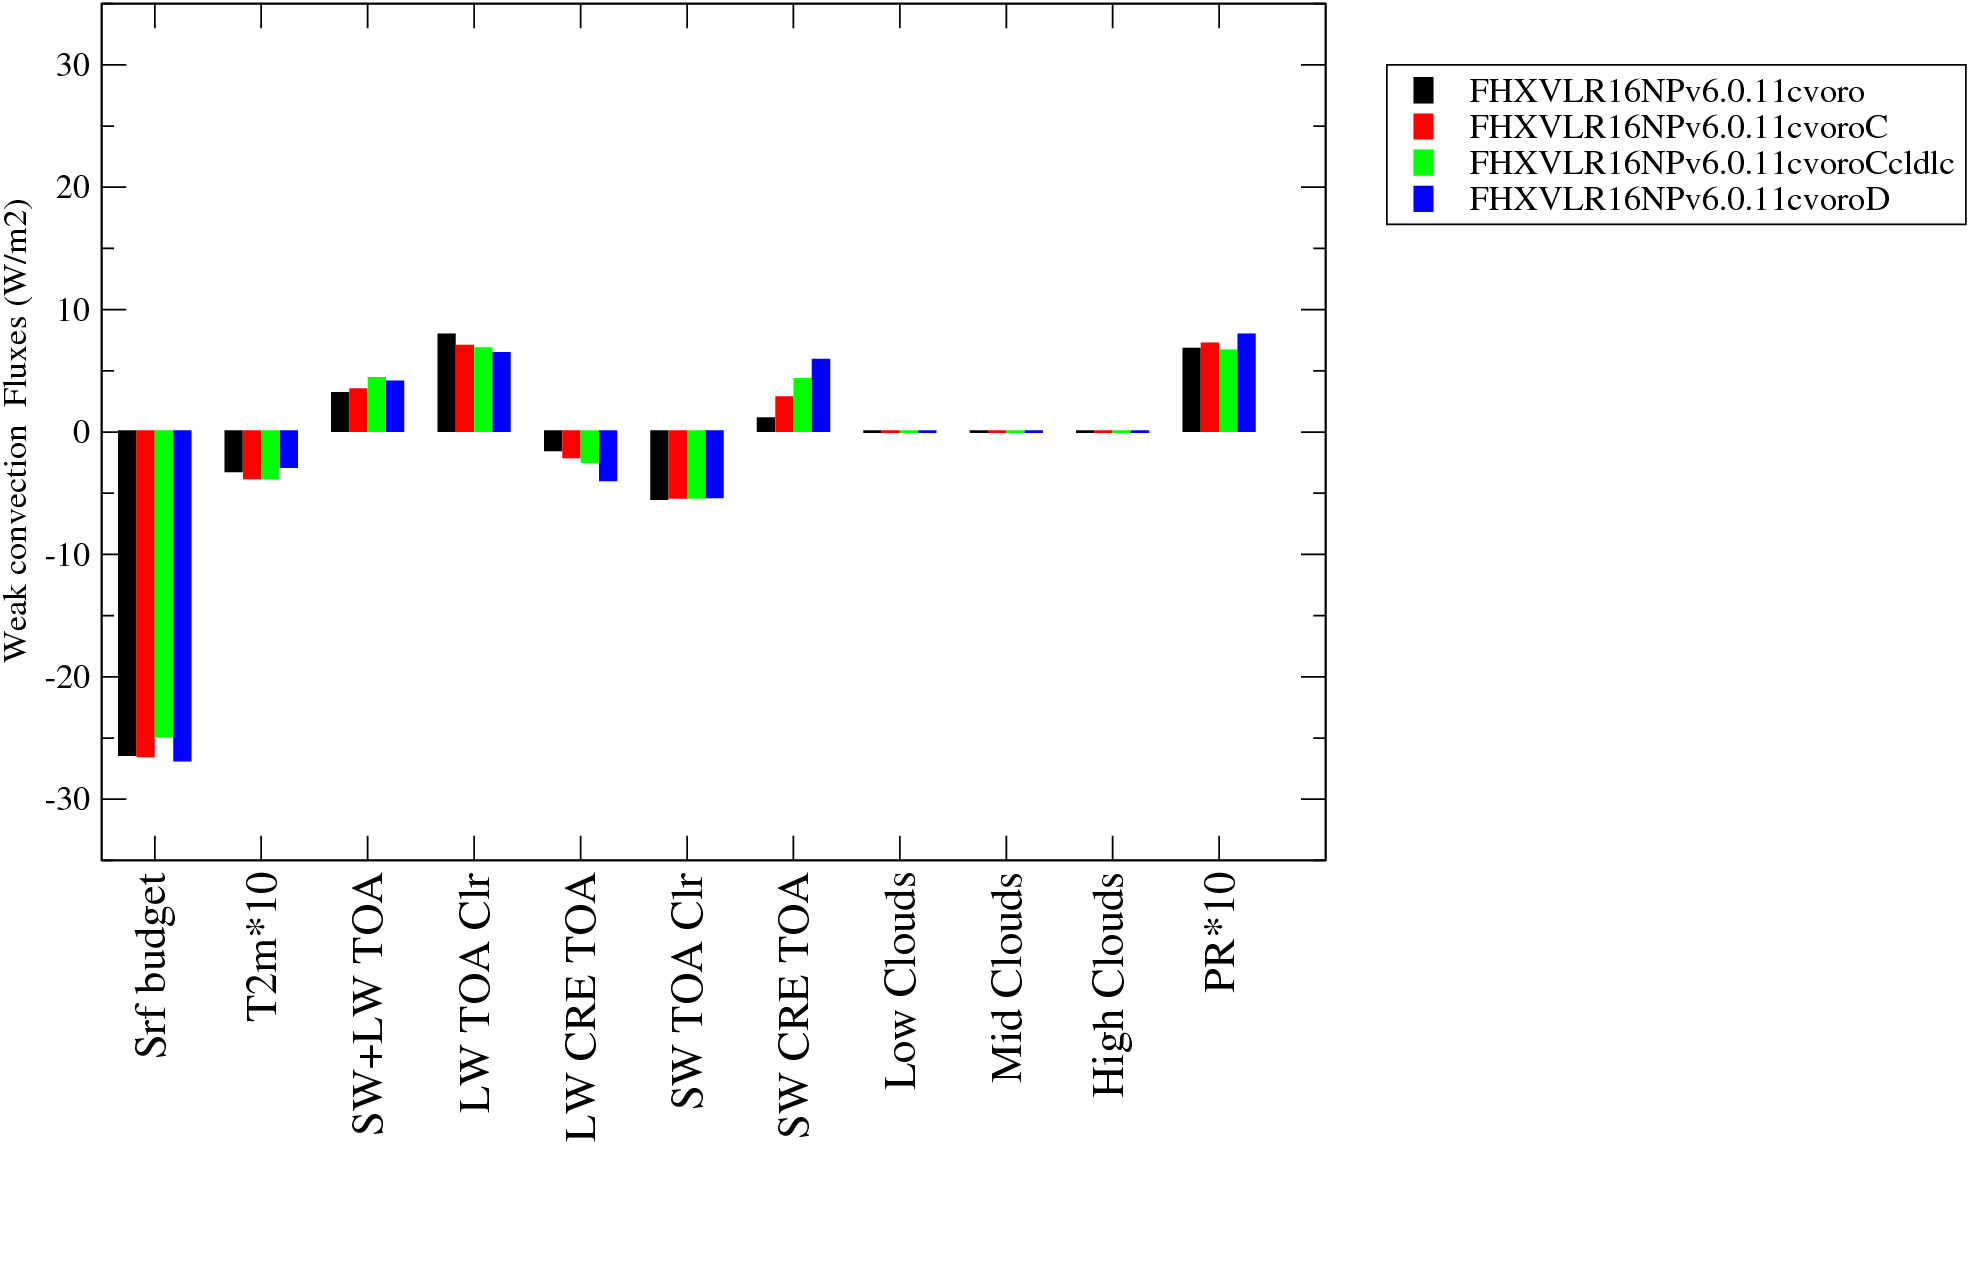
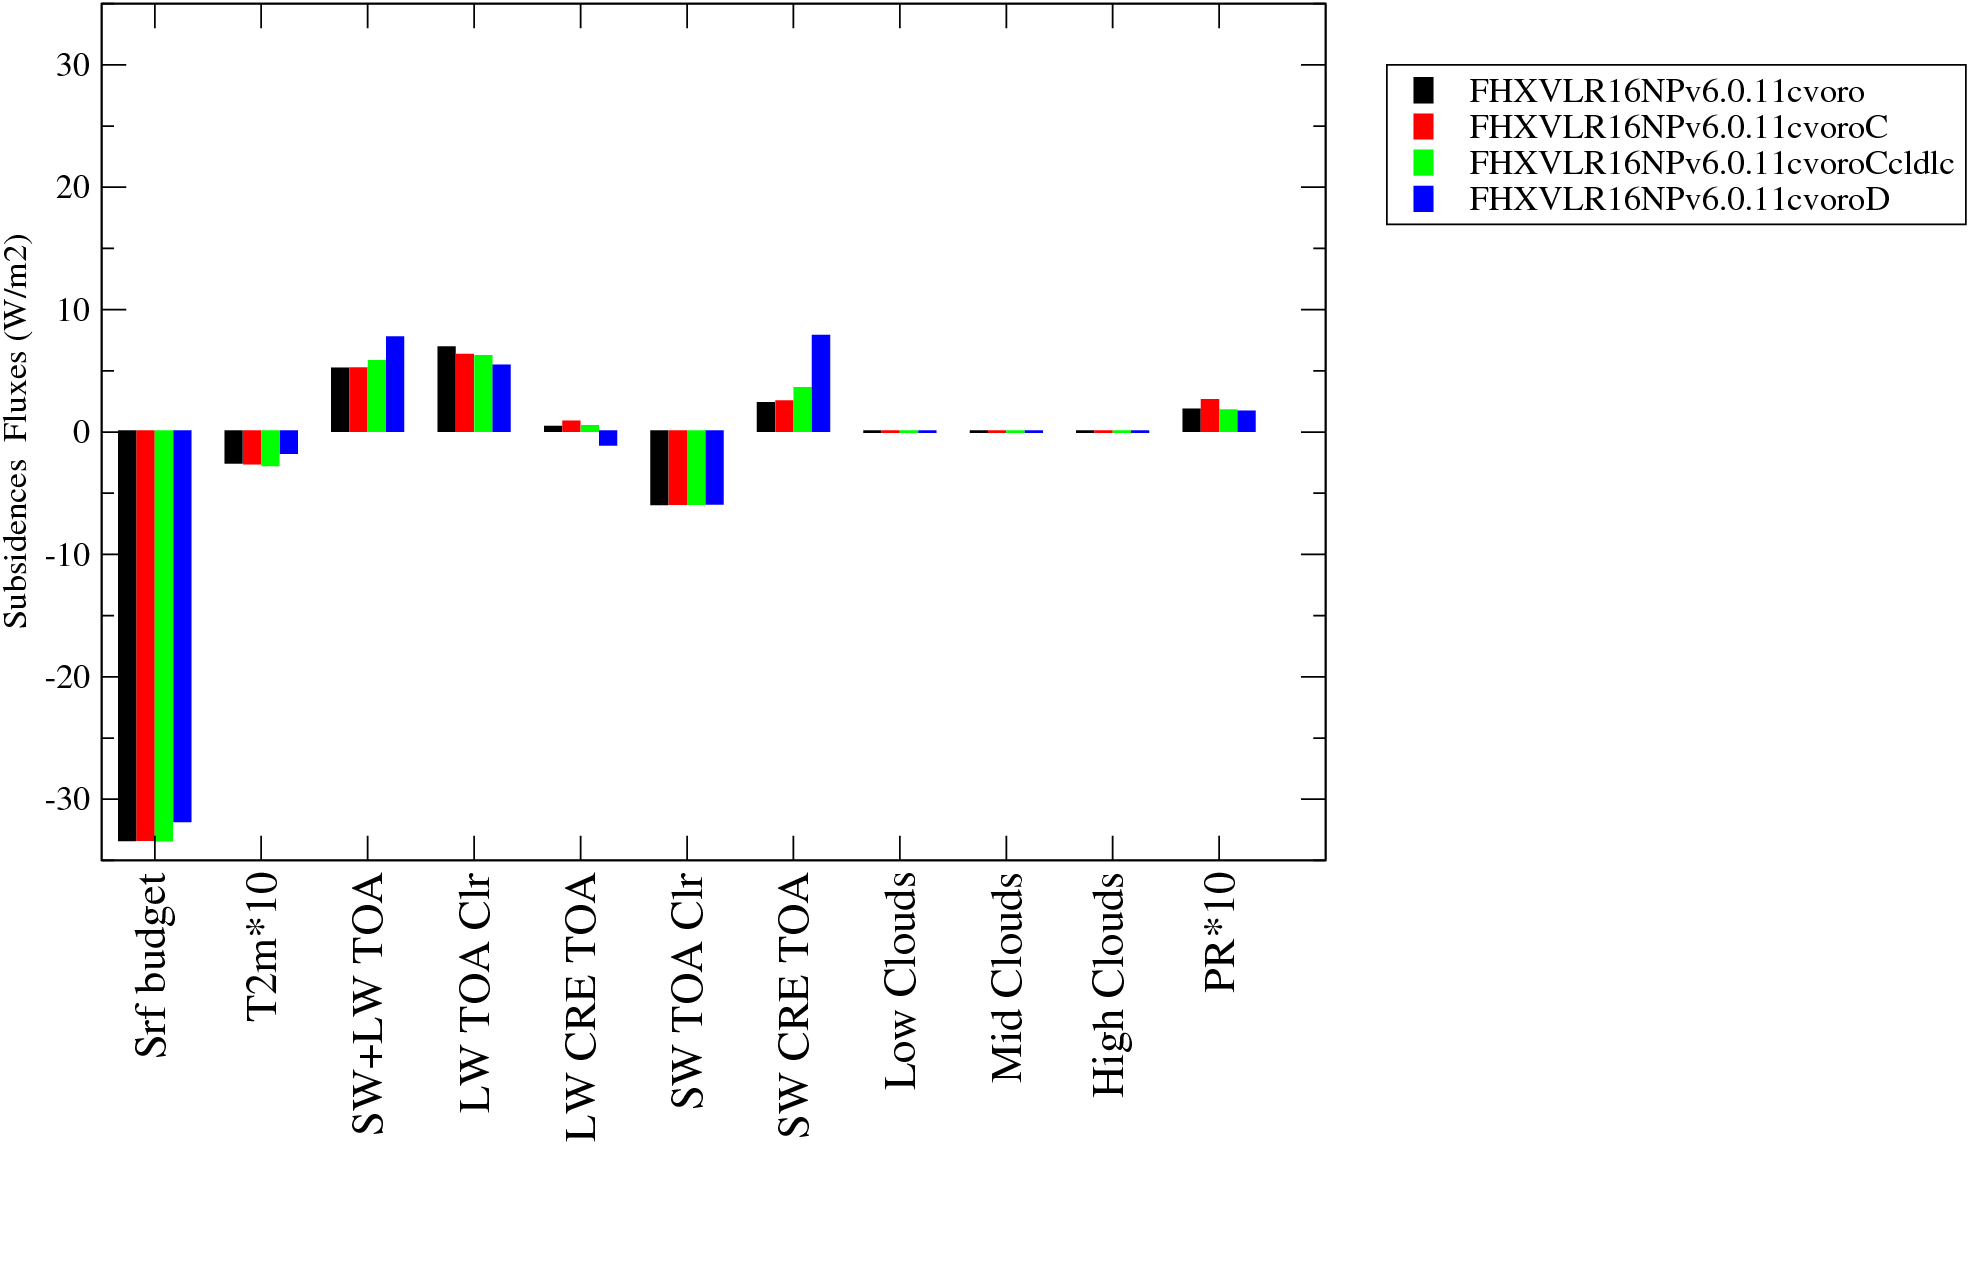
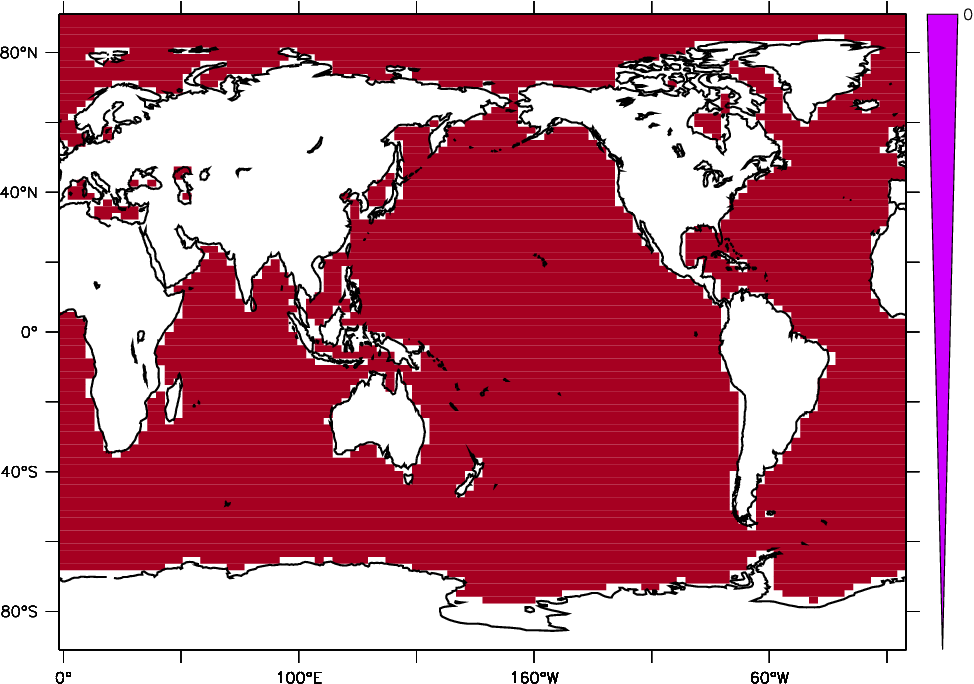
| Convective | Weak | Subsidence | Tropic oceans |
|
|
|
|
|
|
|
|
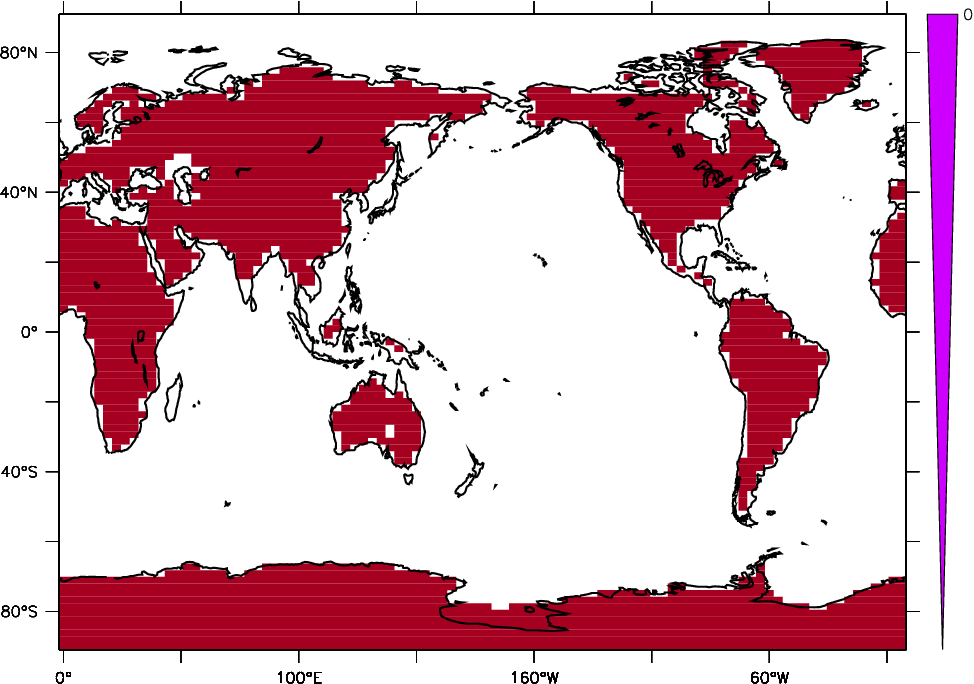
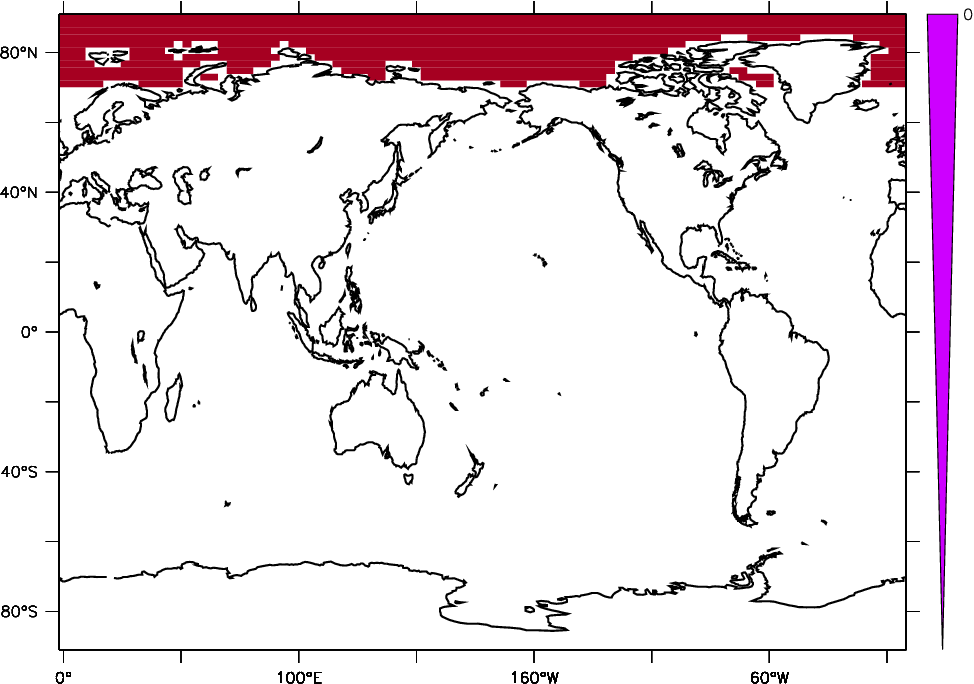
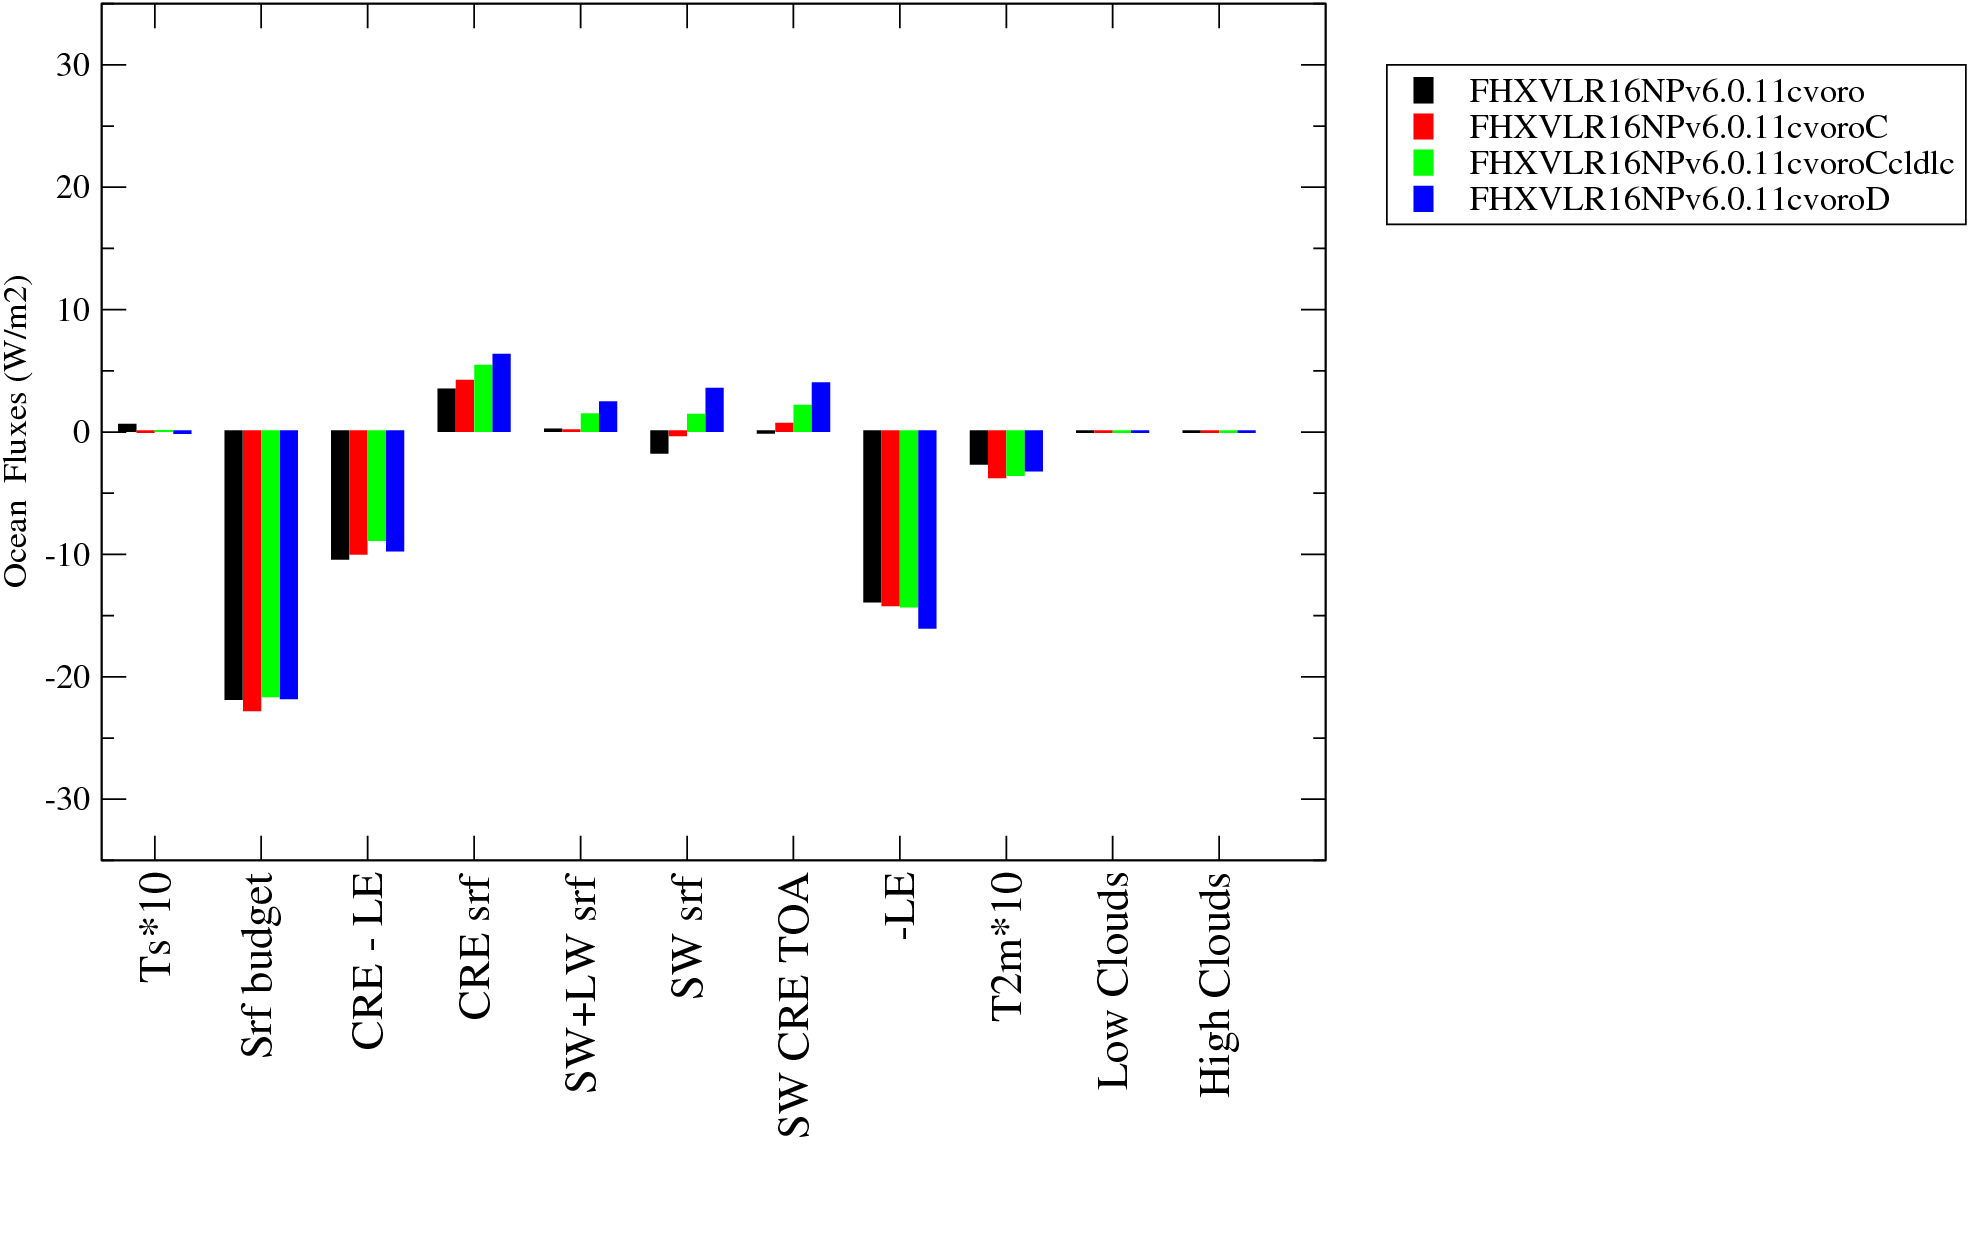
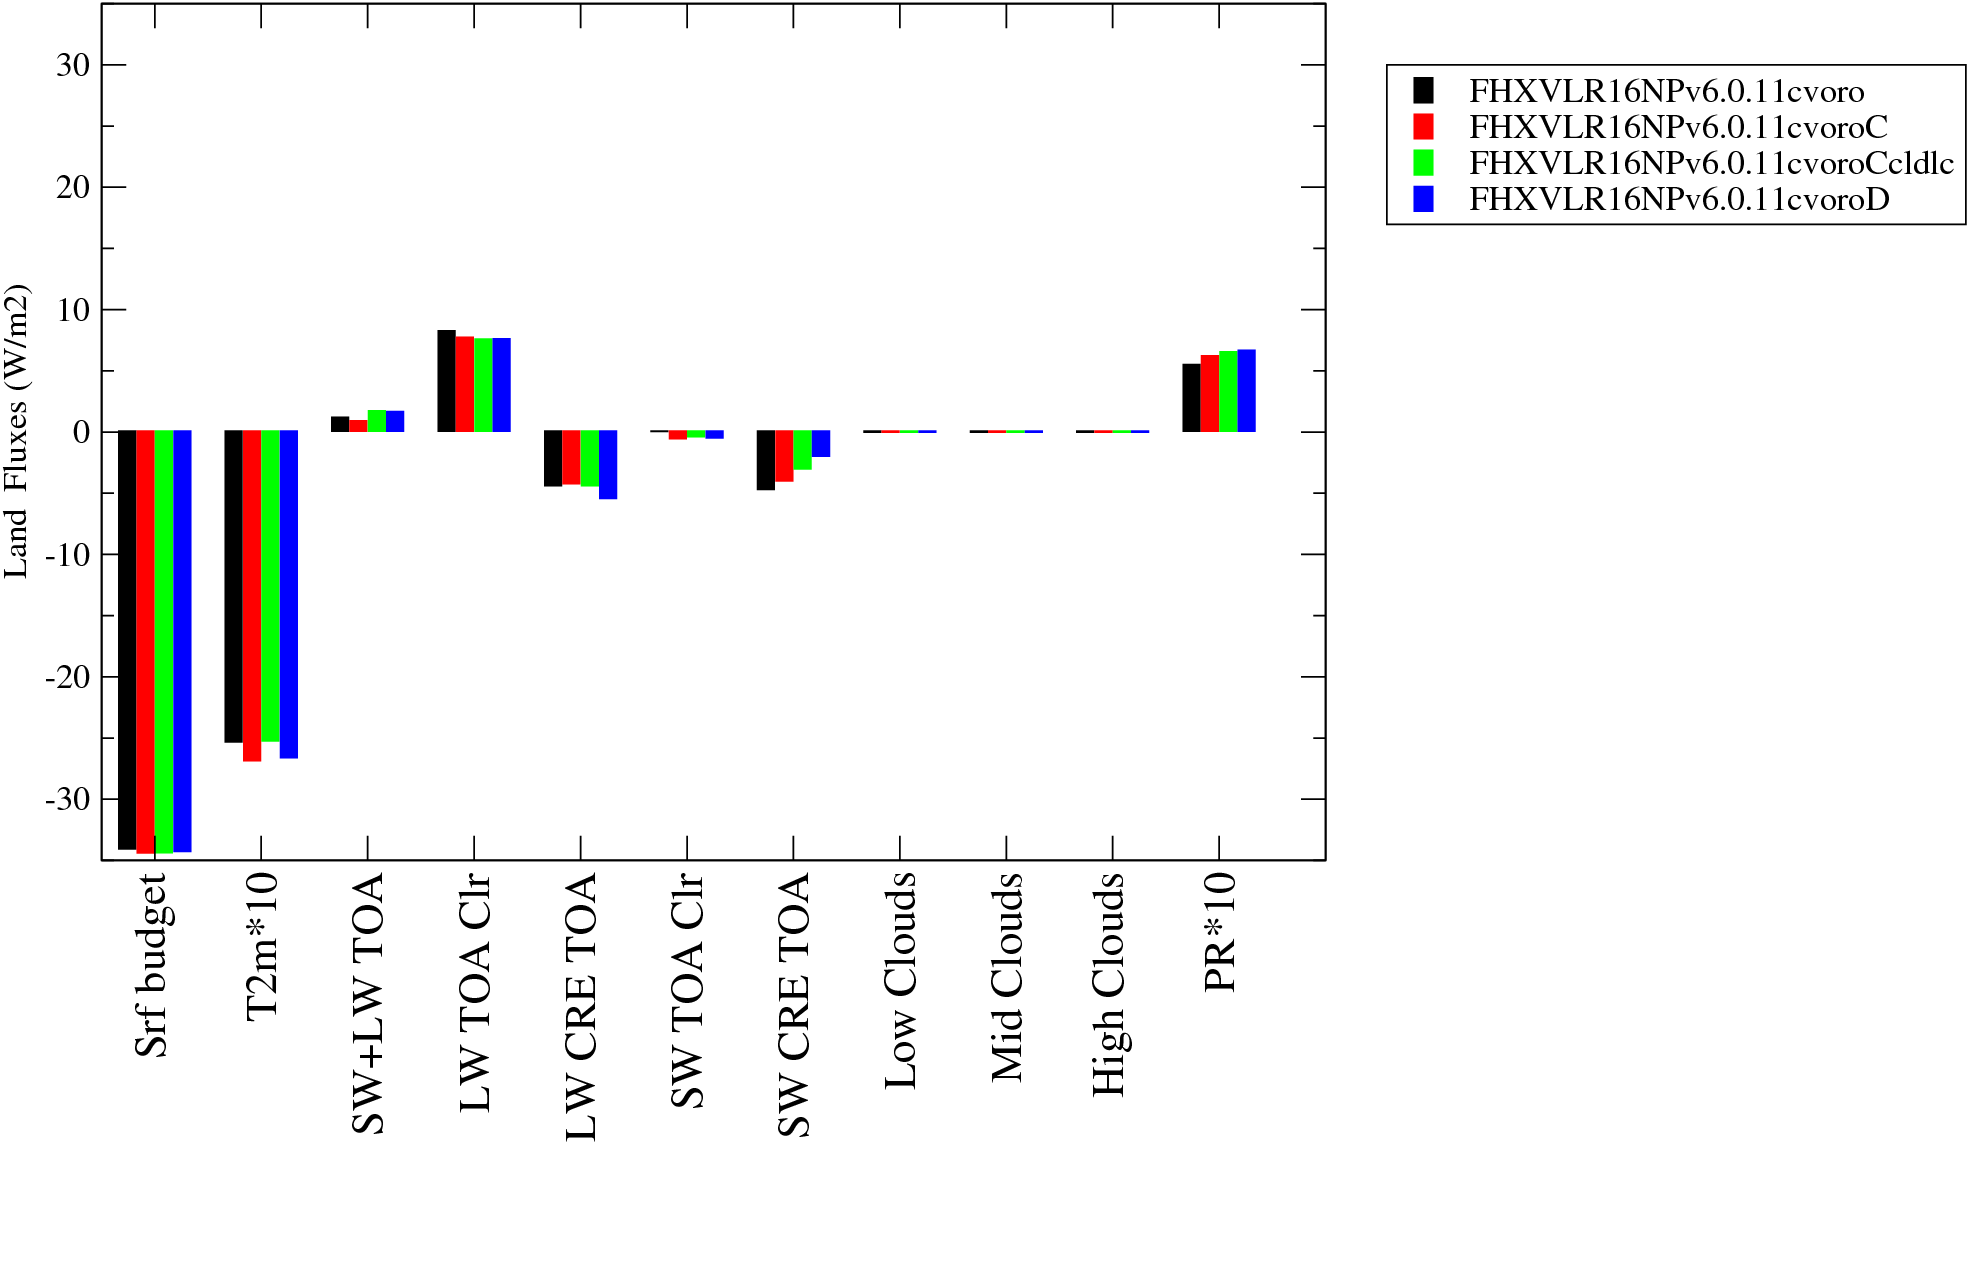
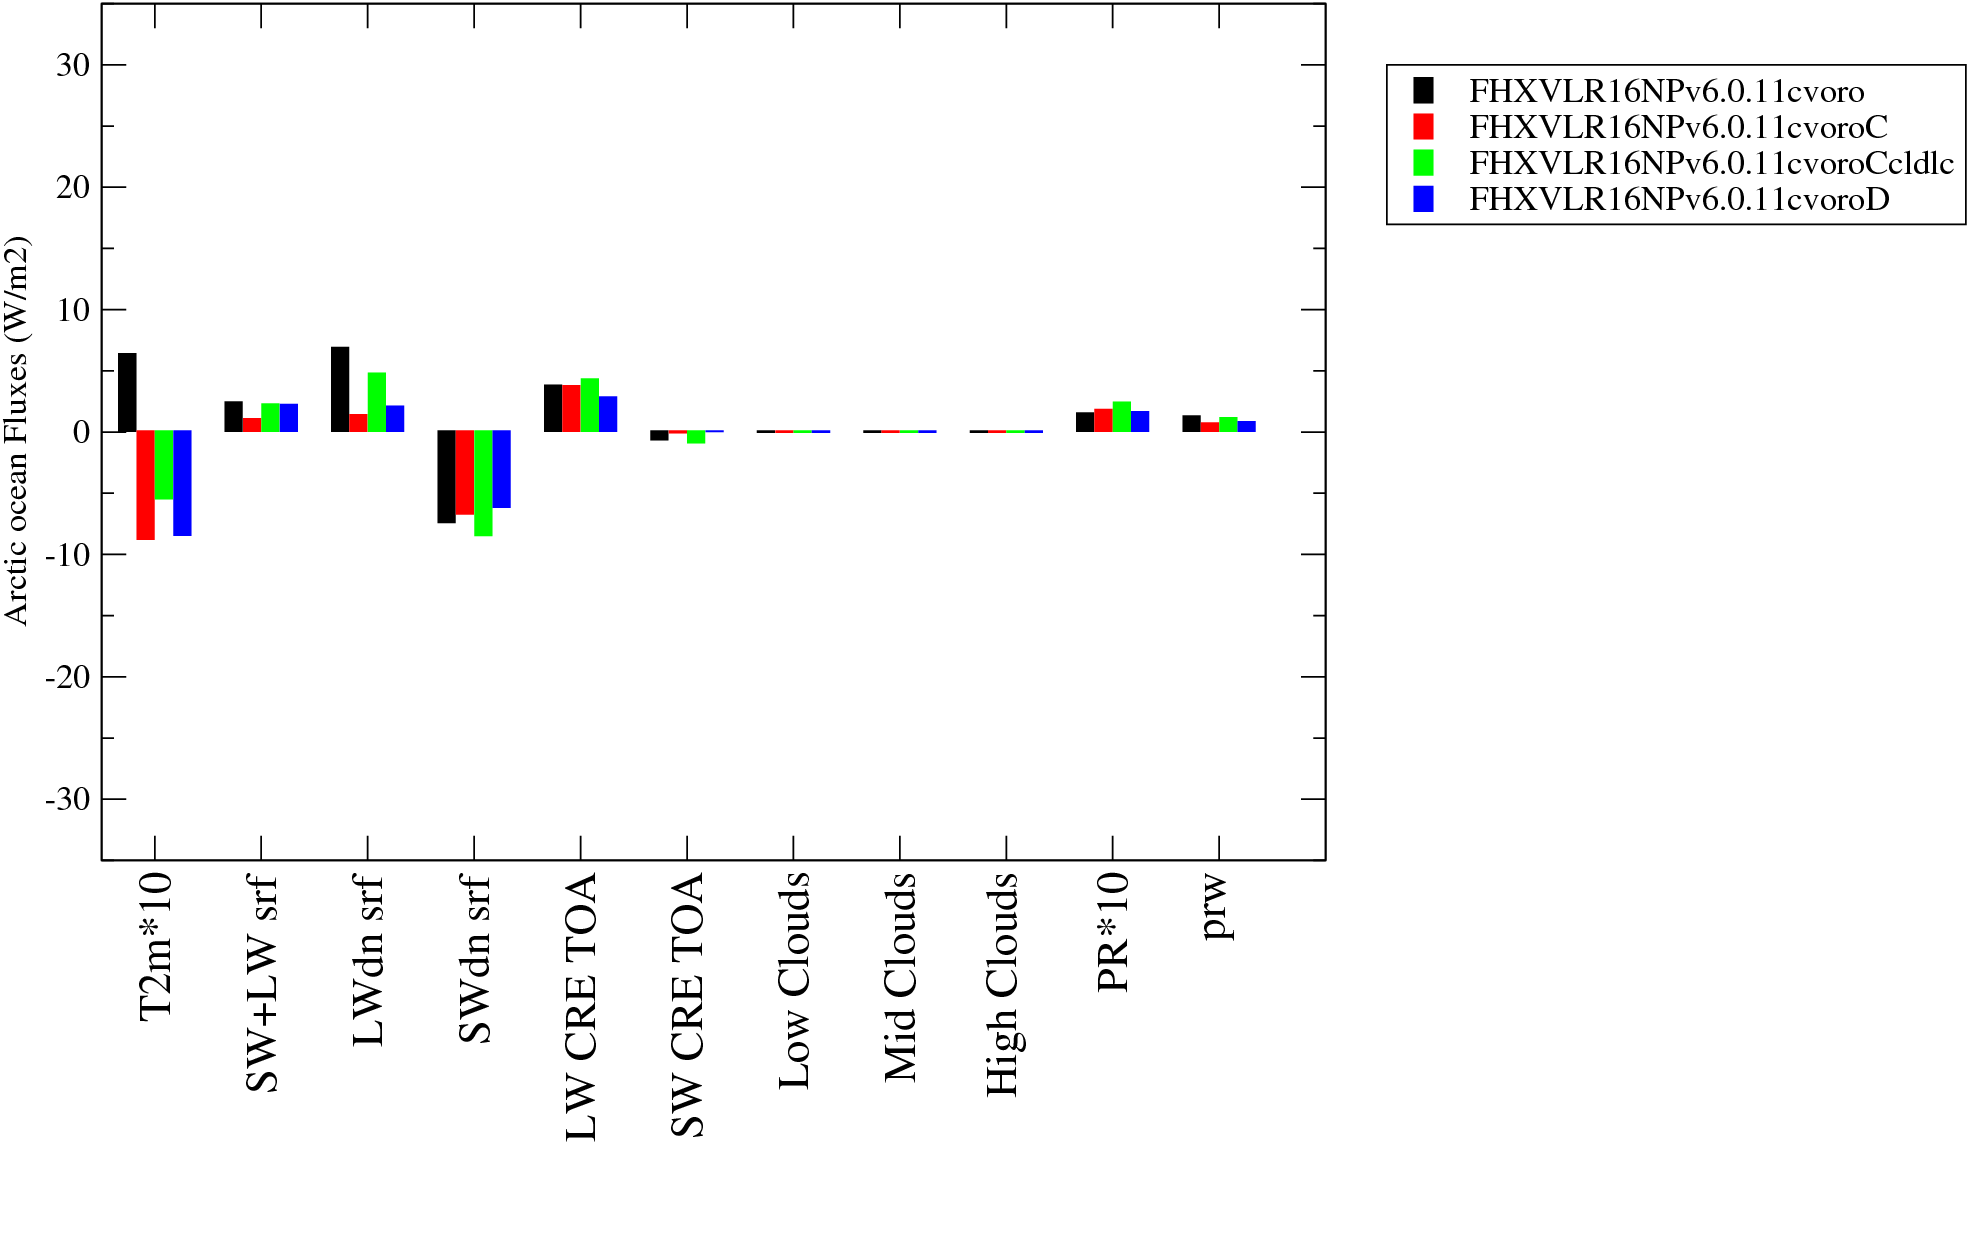
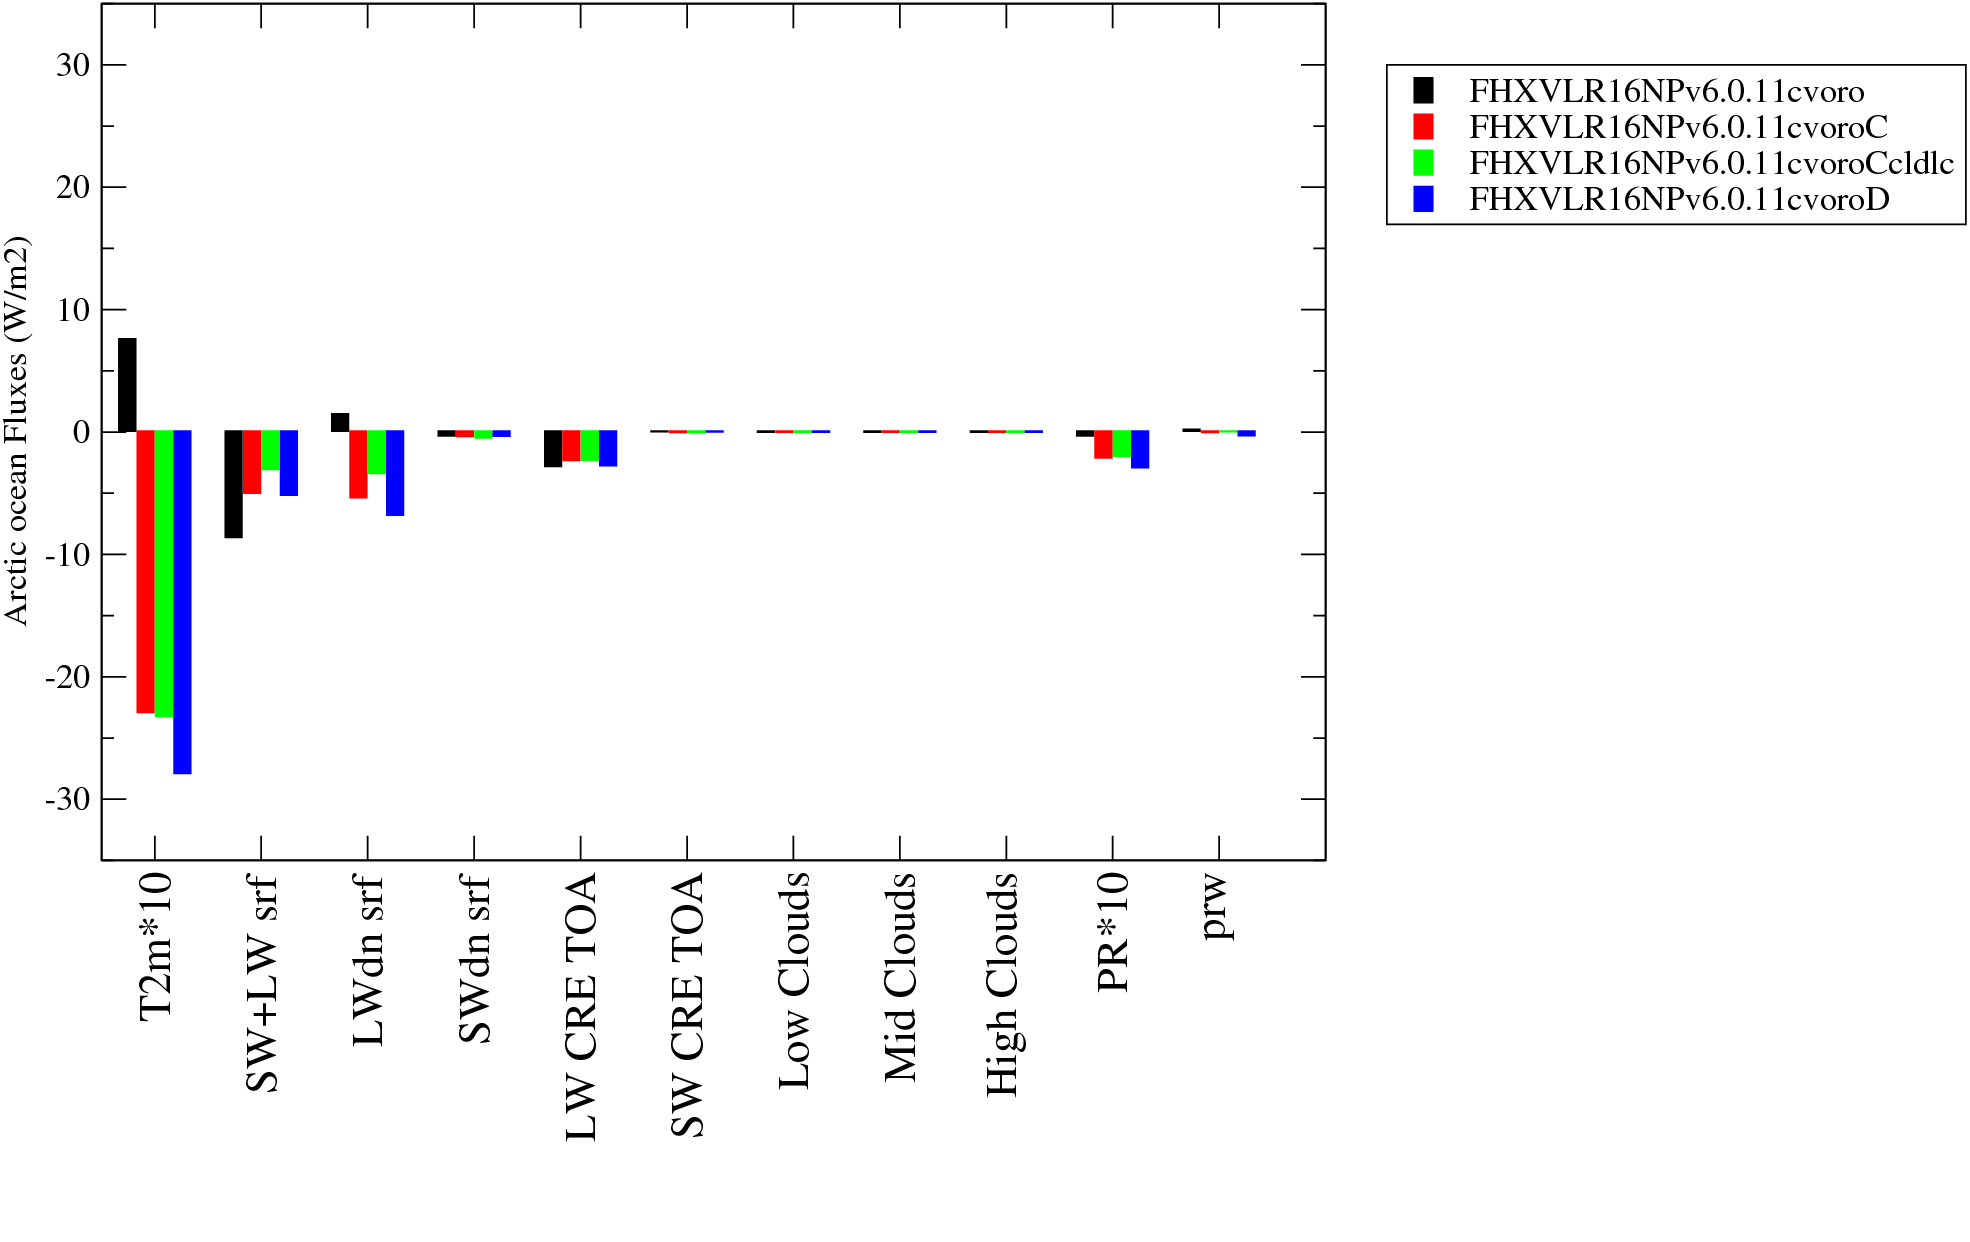
| Oceans | Continent | N. Atlantic | Arctic Oce. |
|
|
|
|
|
|
|
|
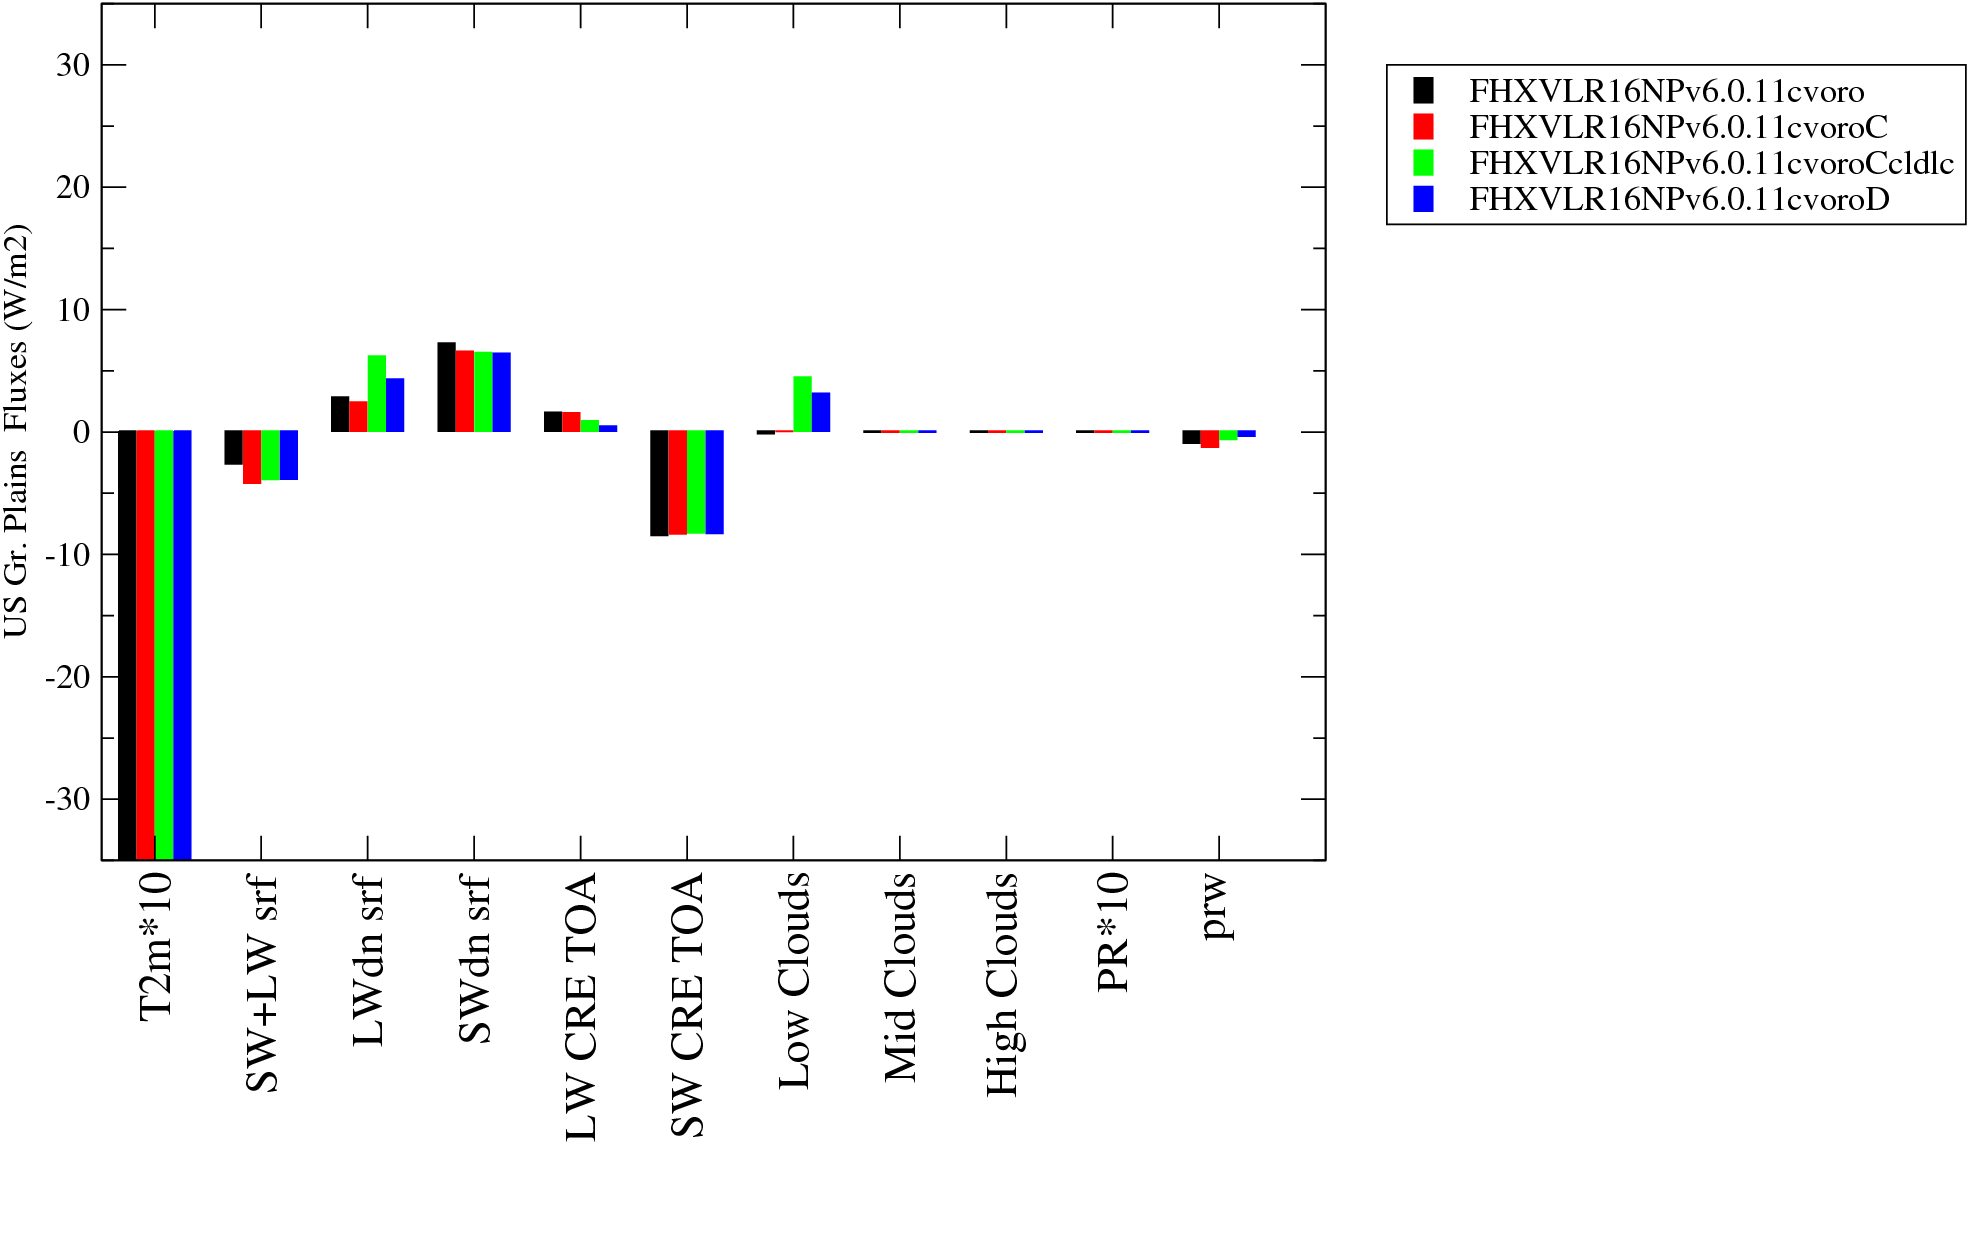
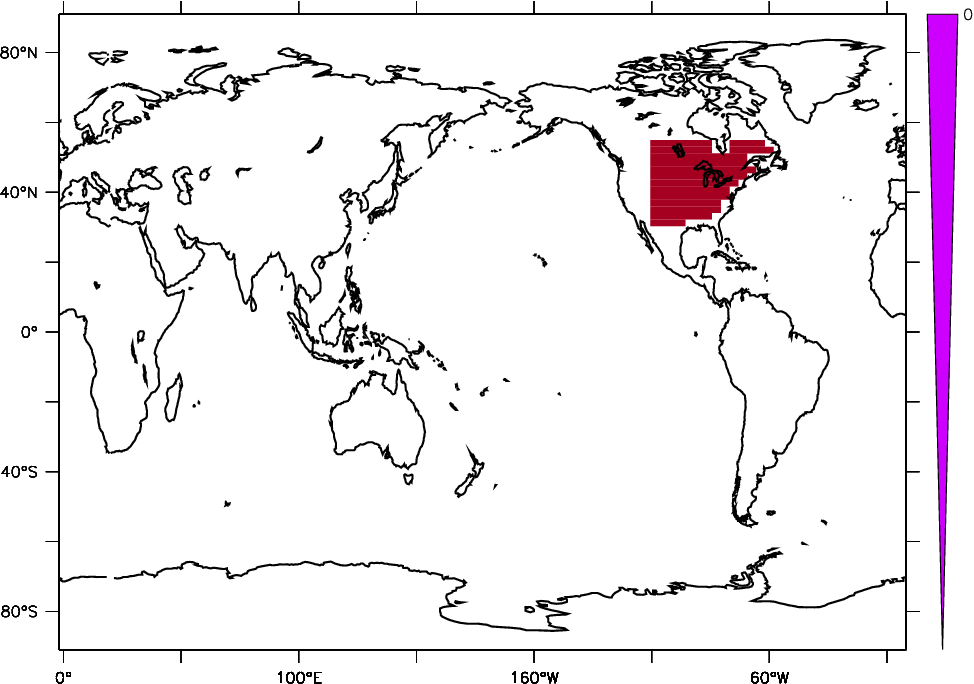
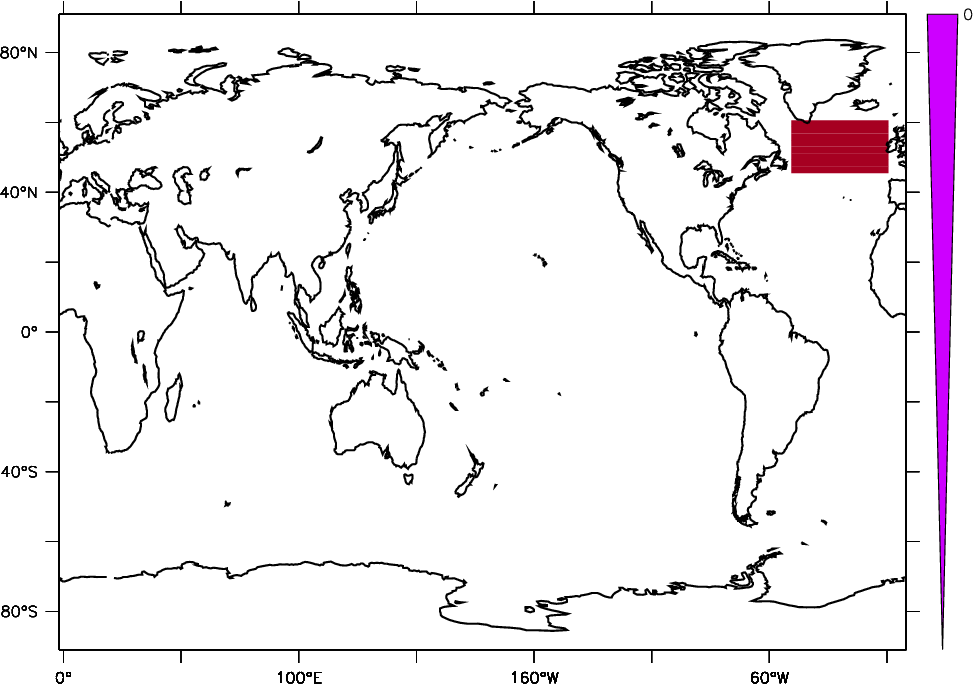
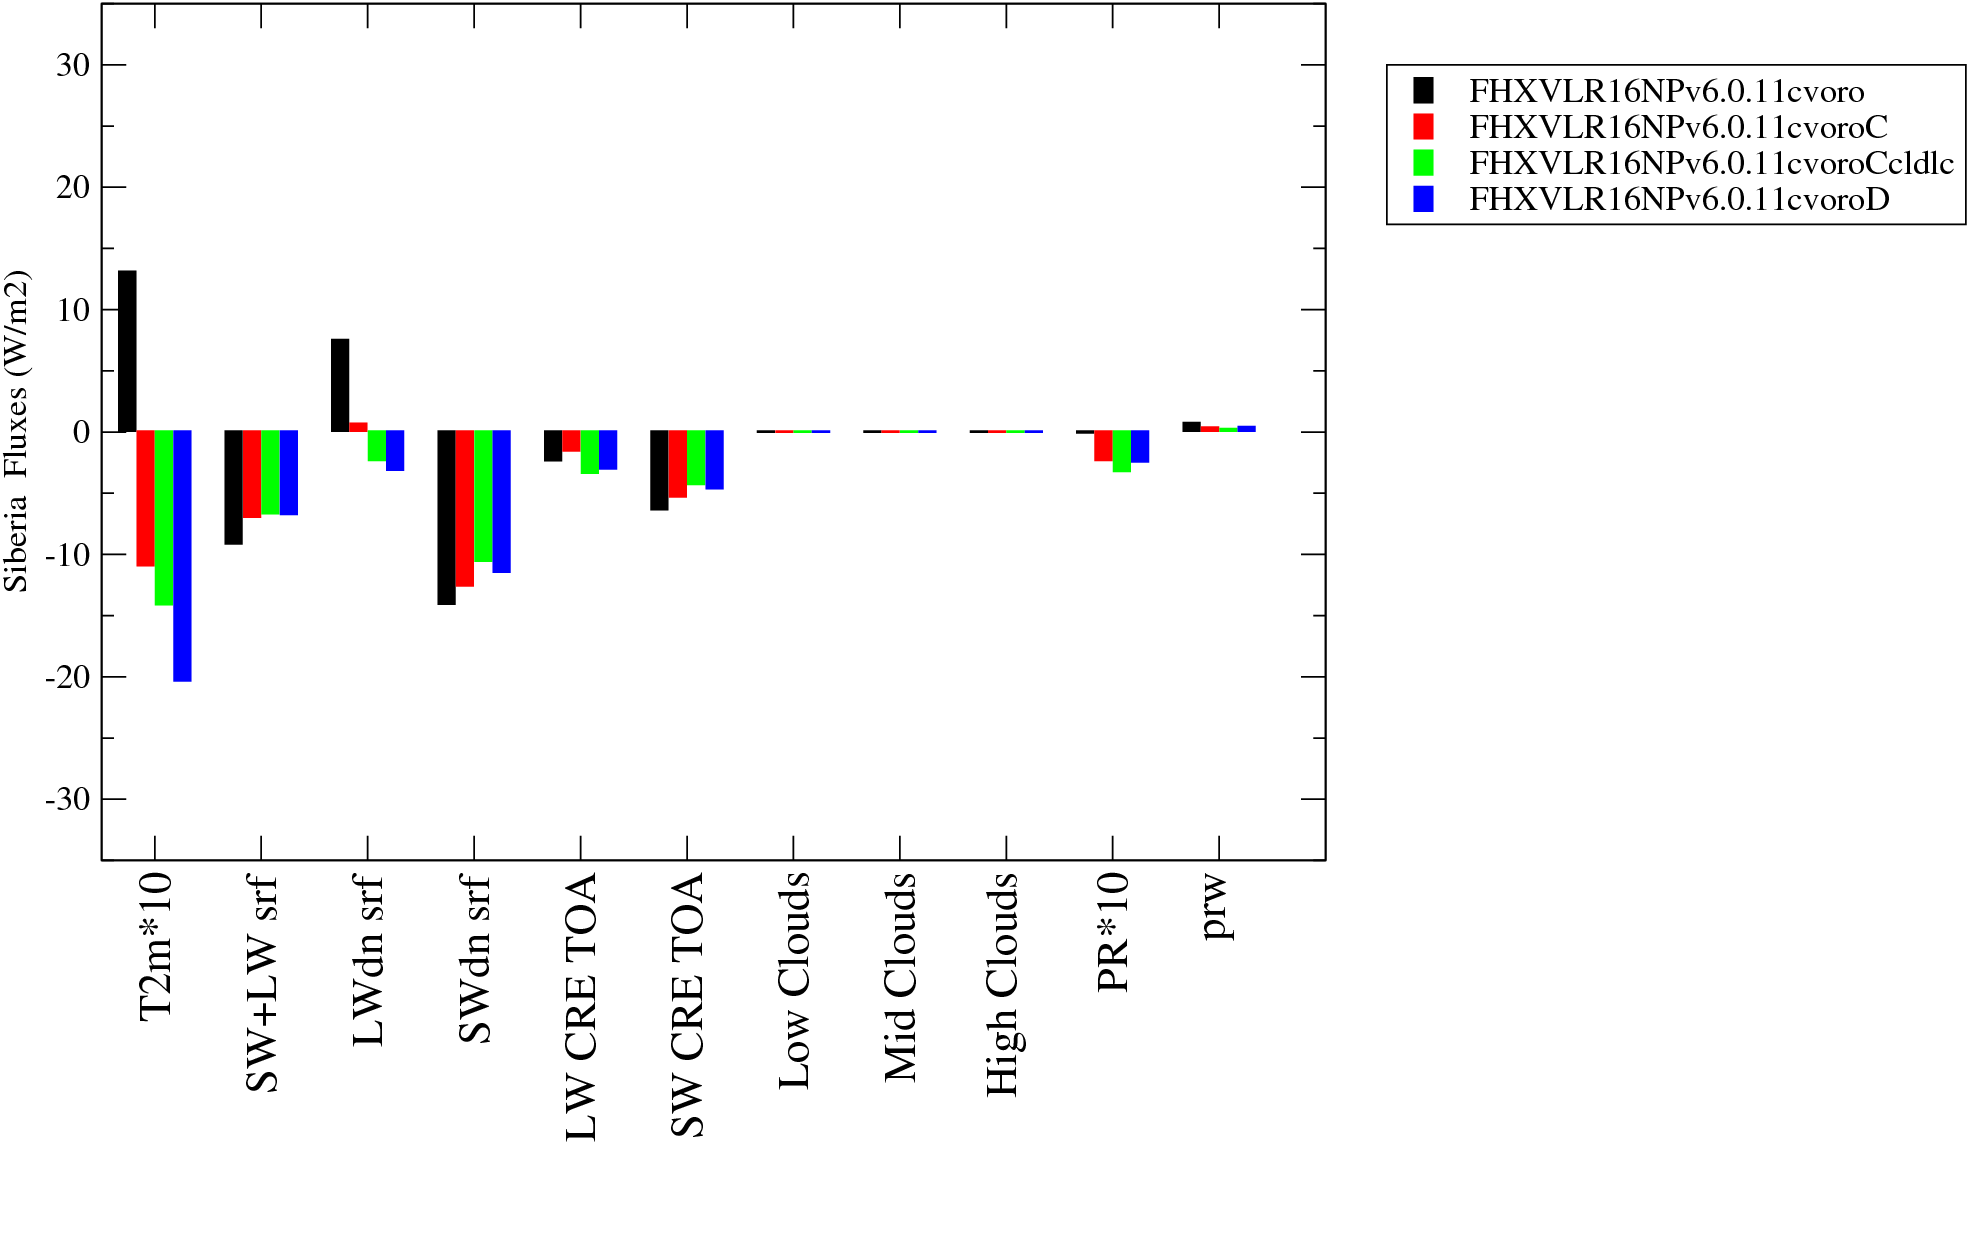
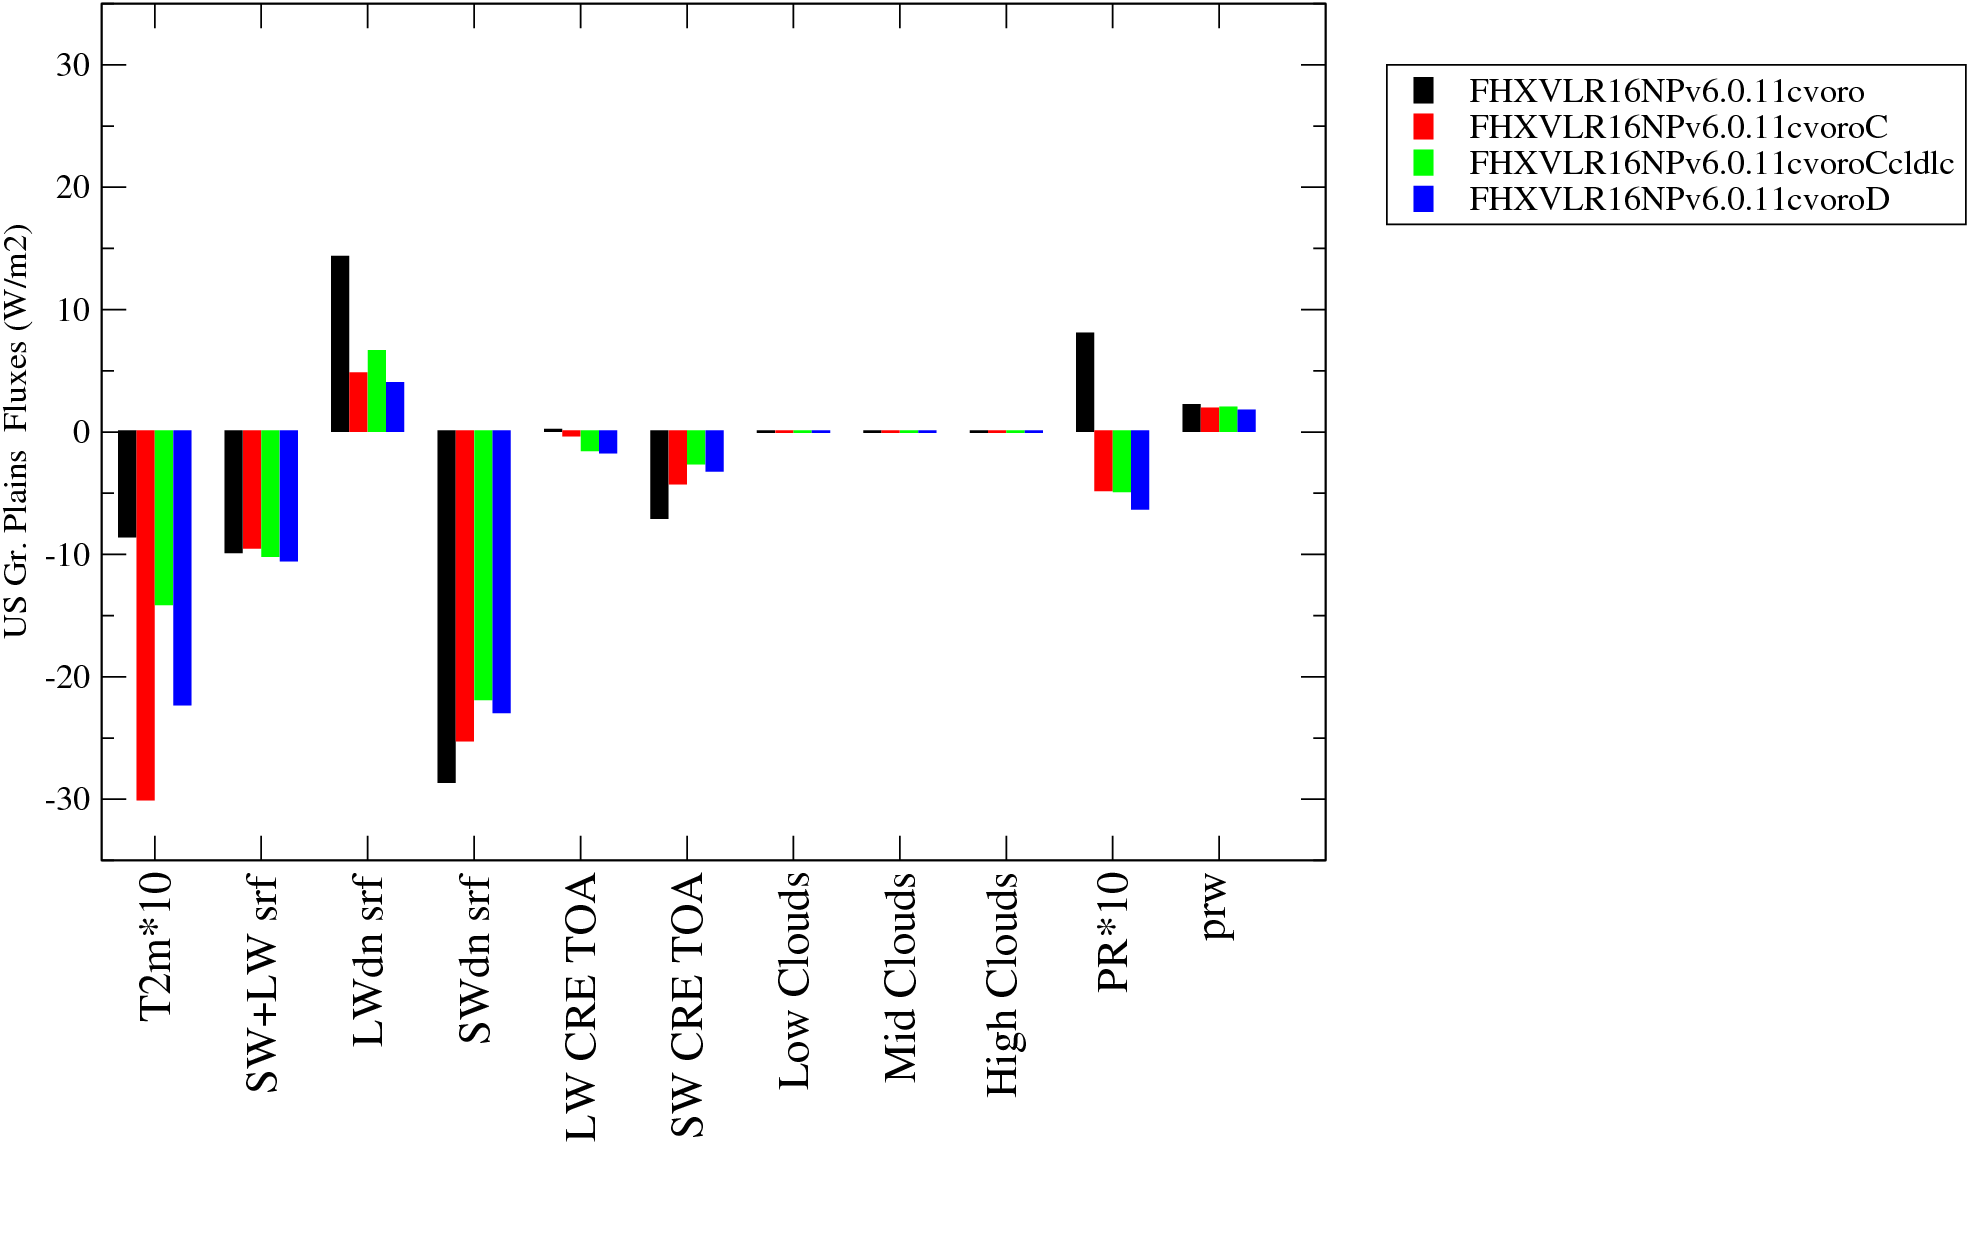
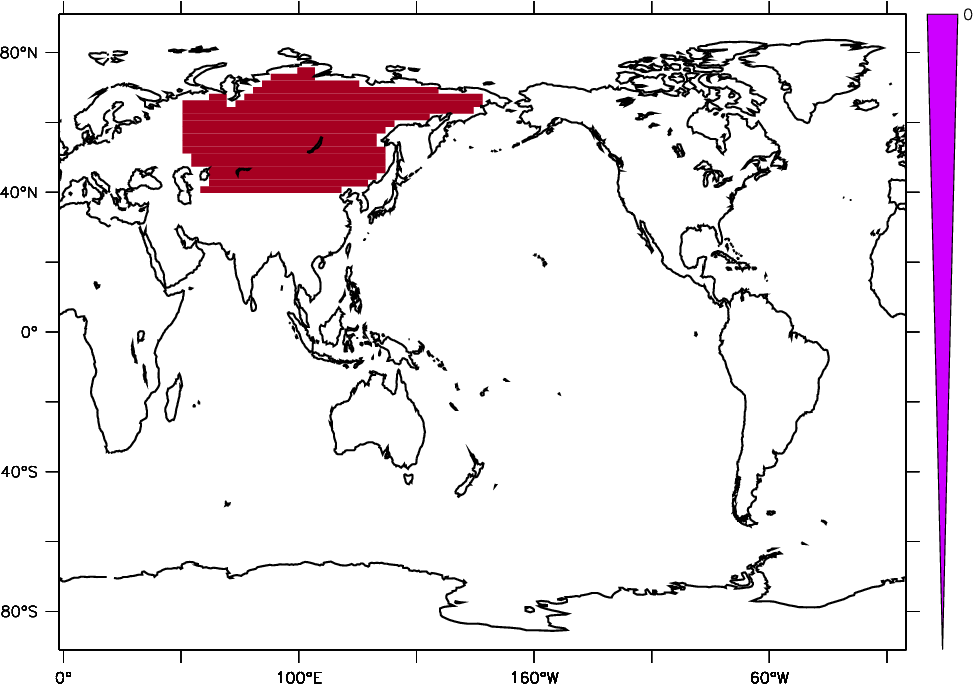
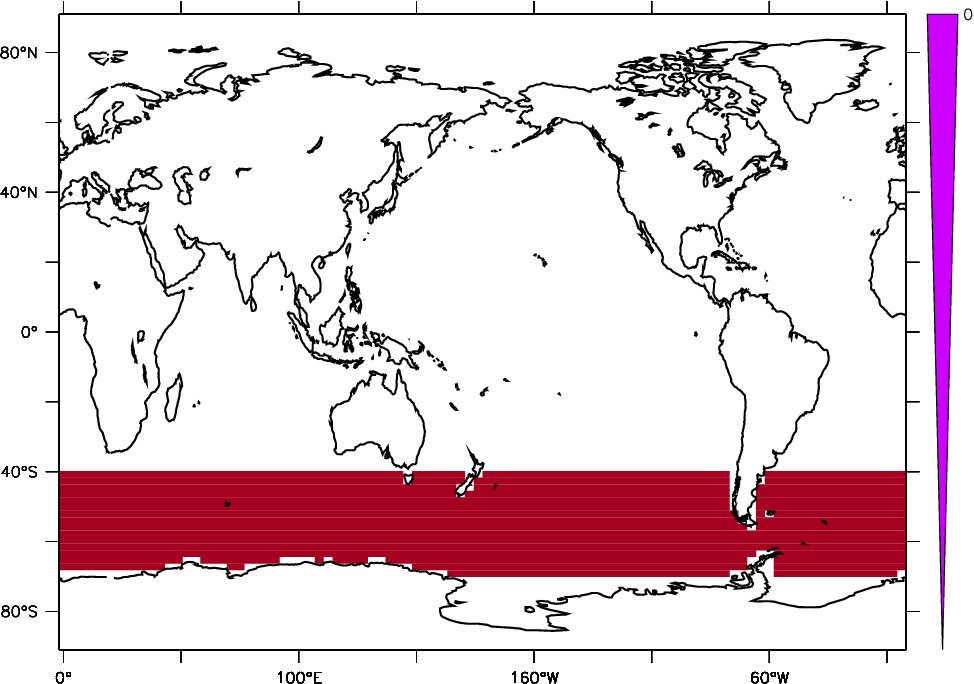
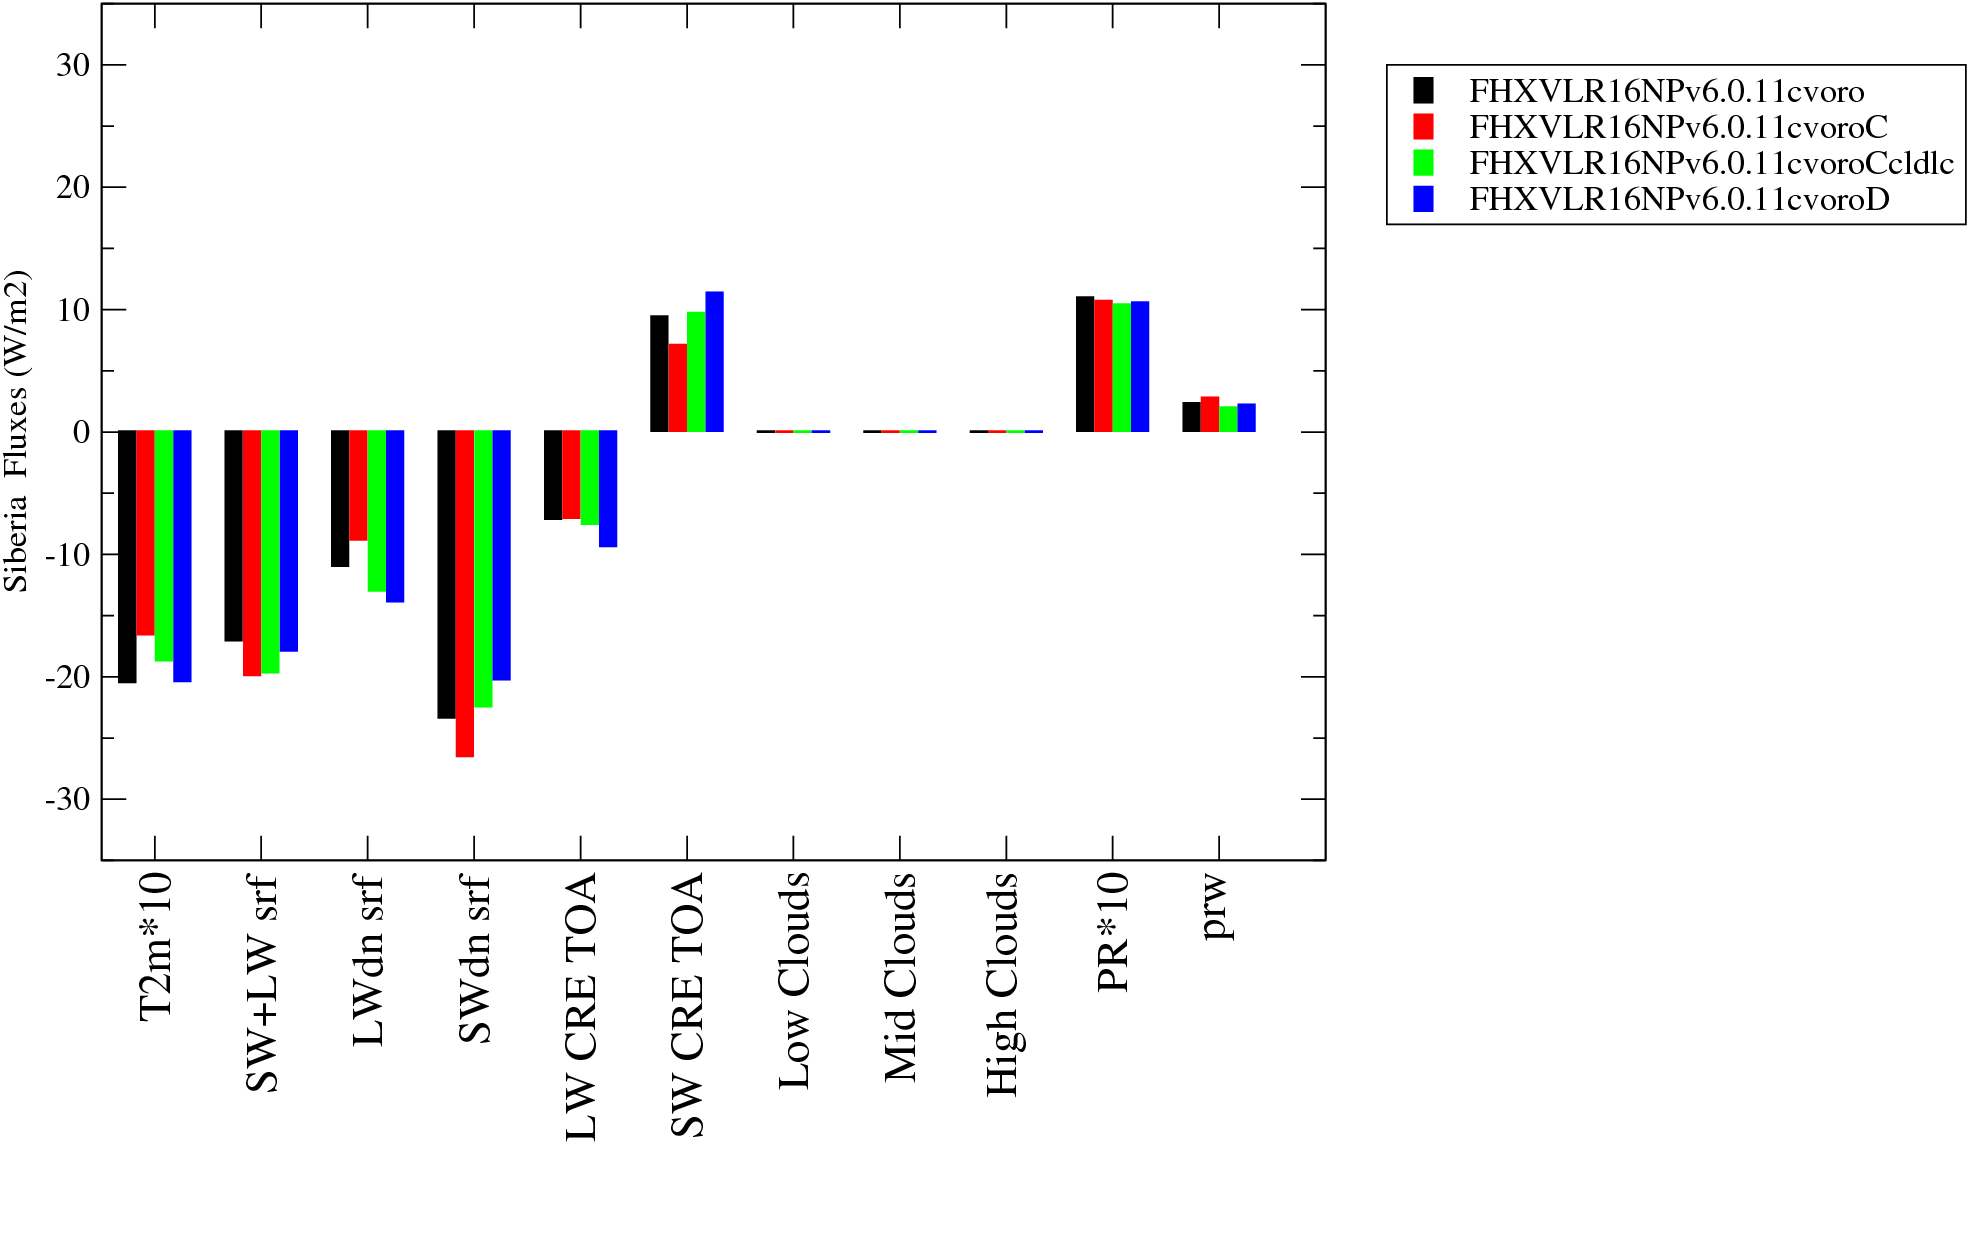
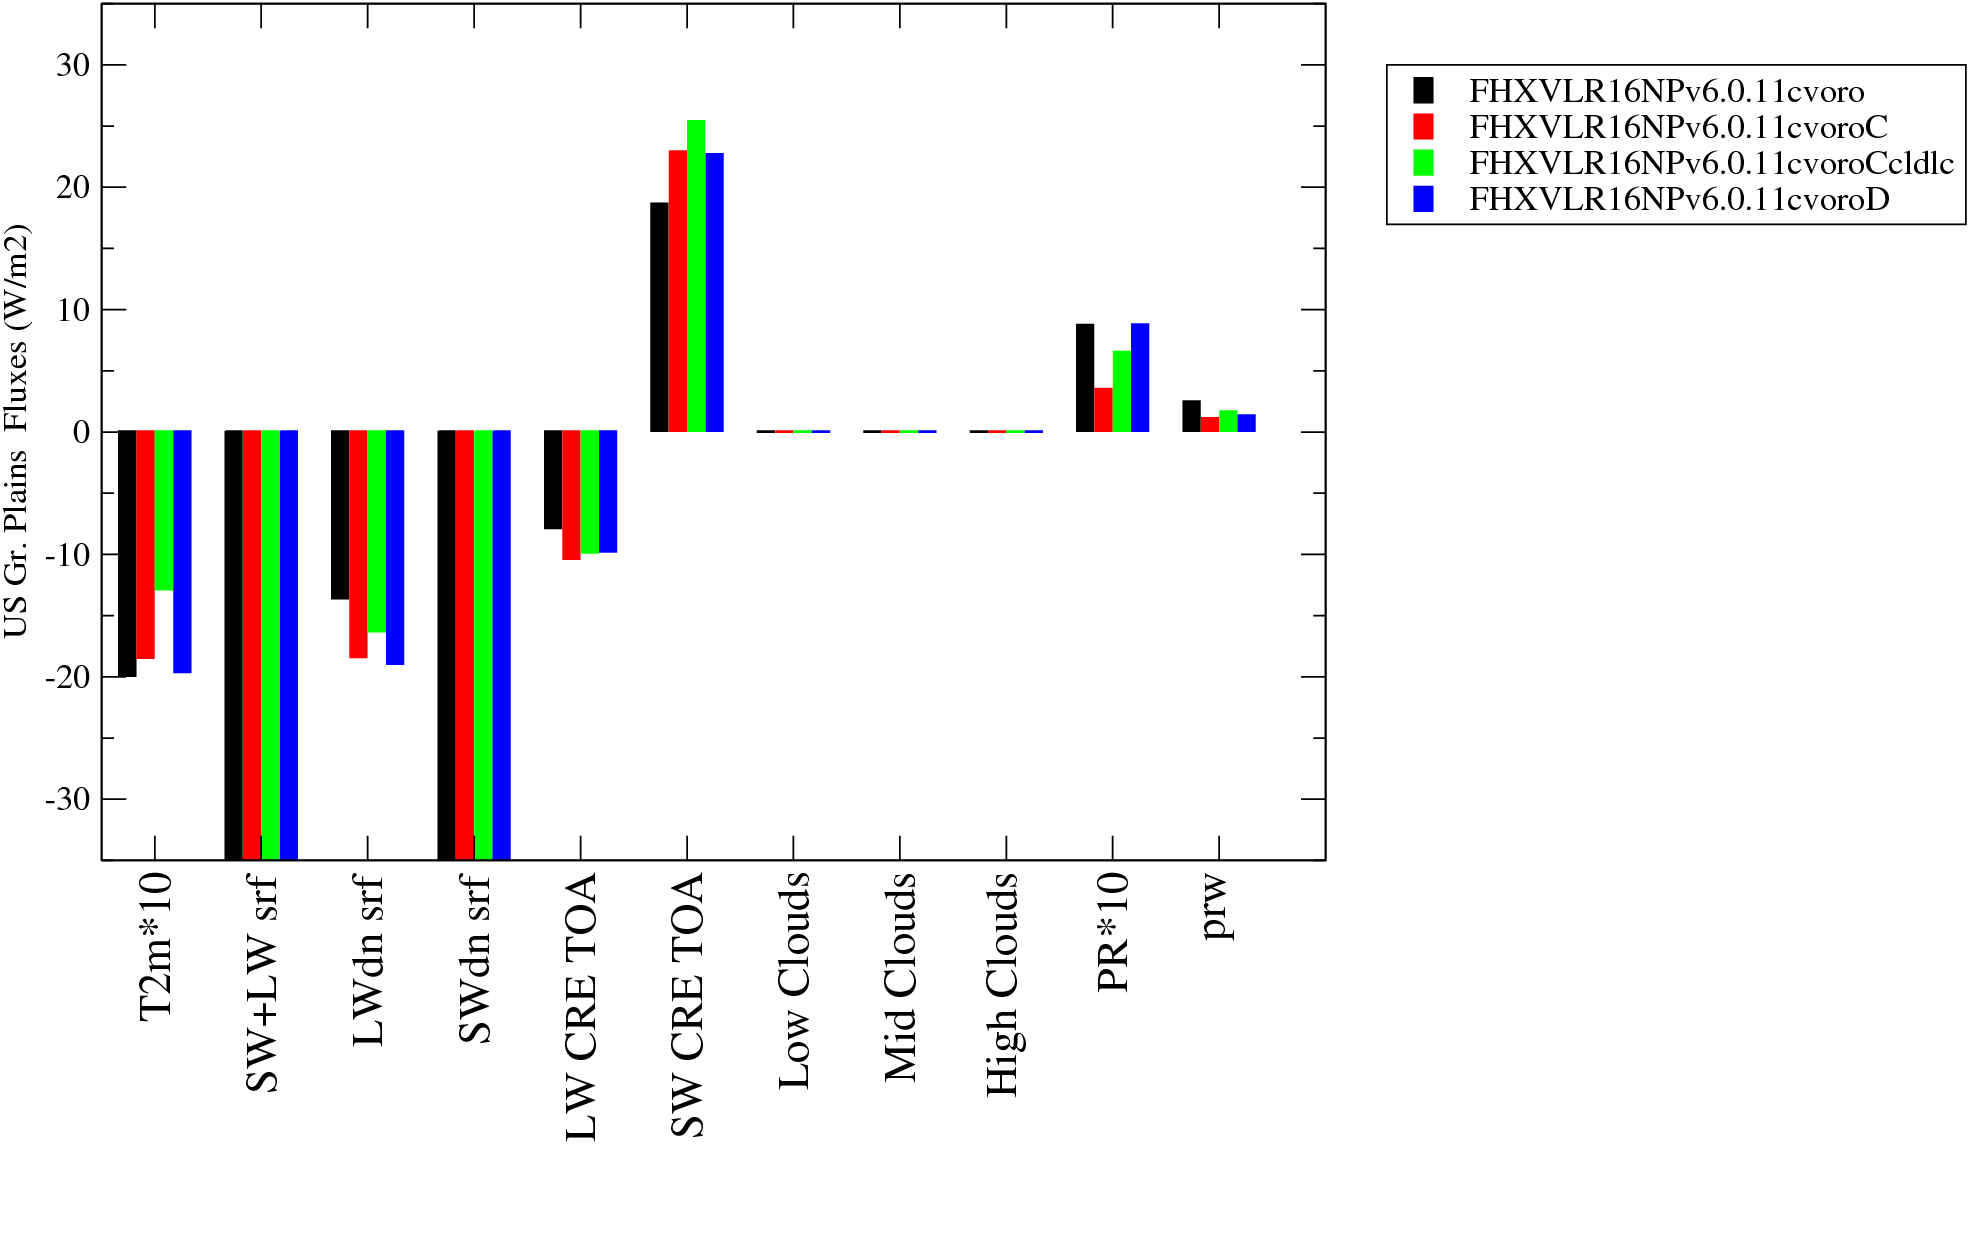
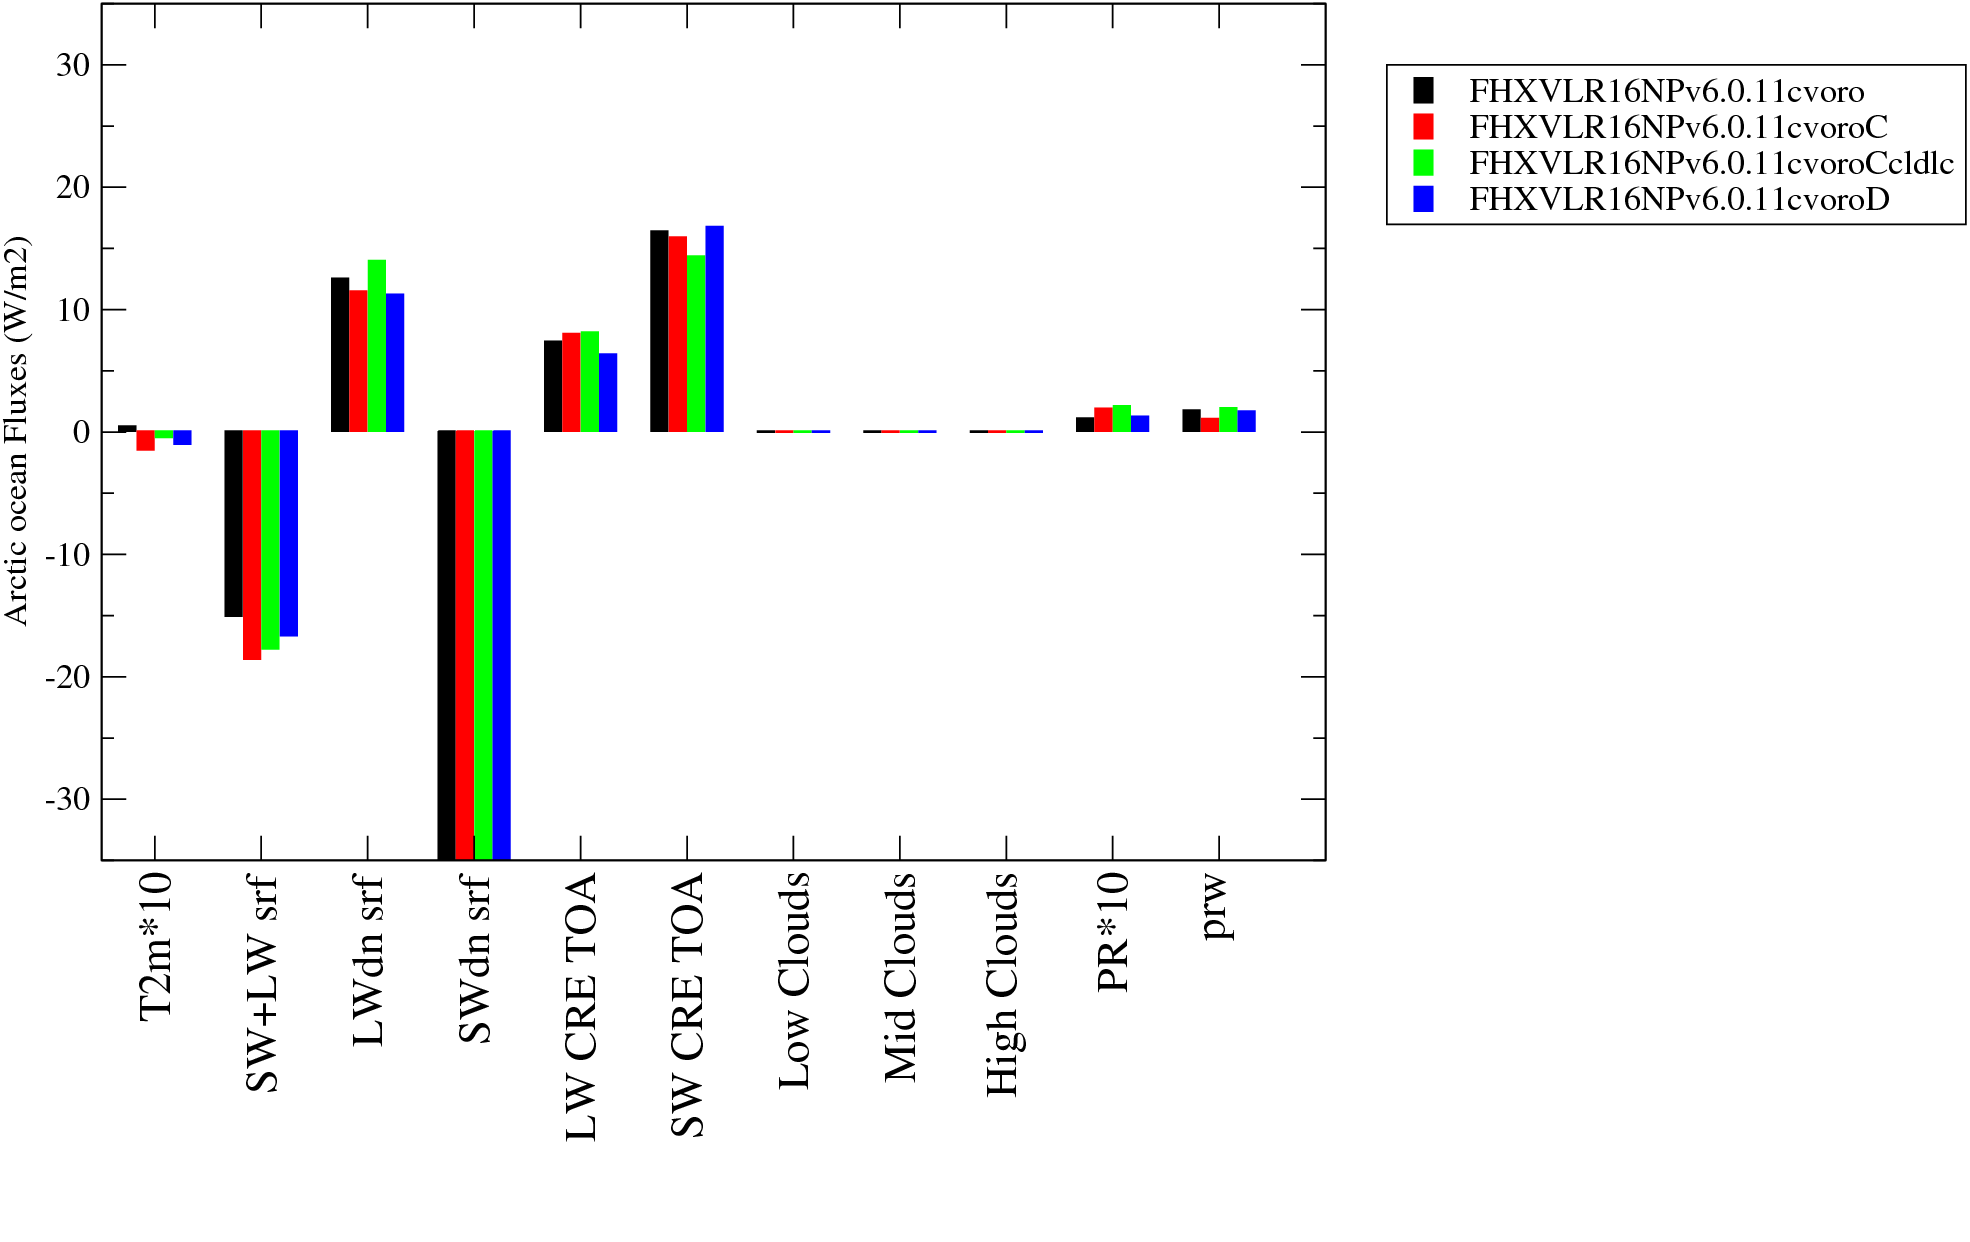
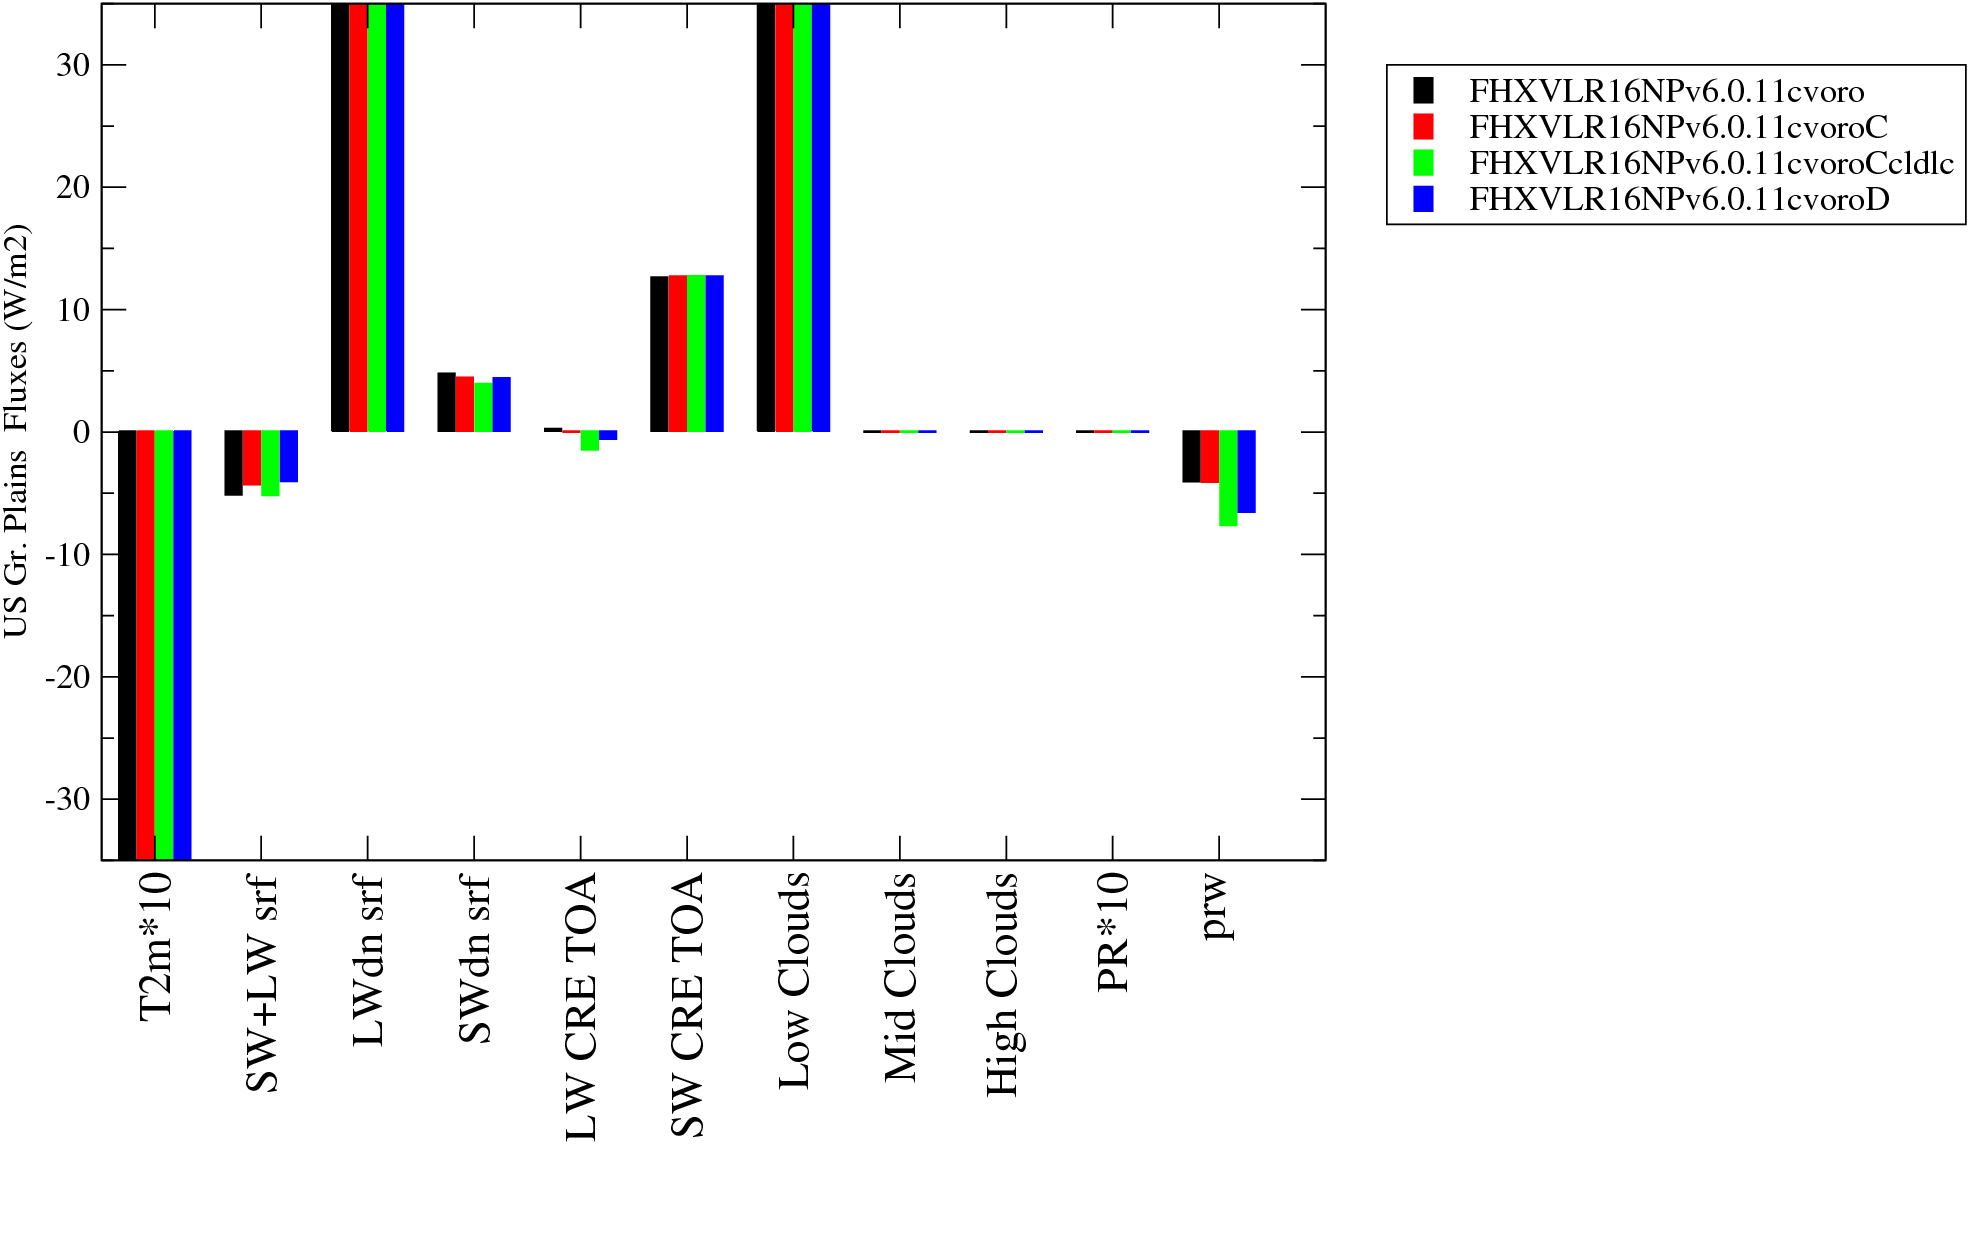
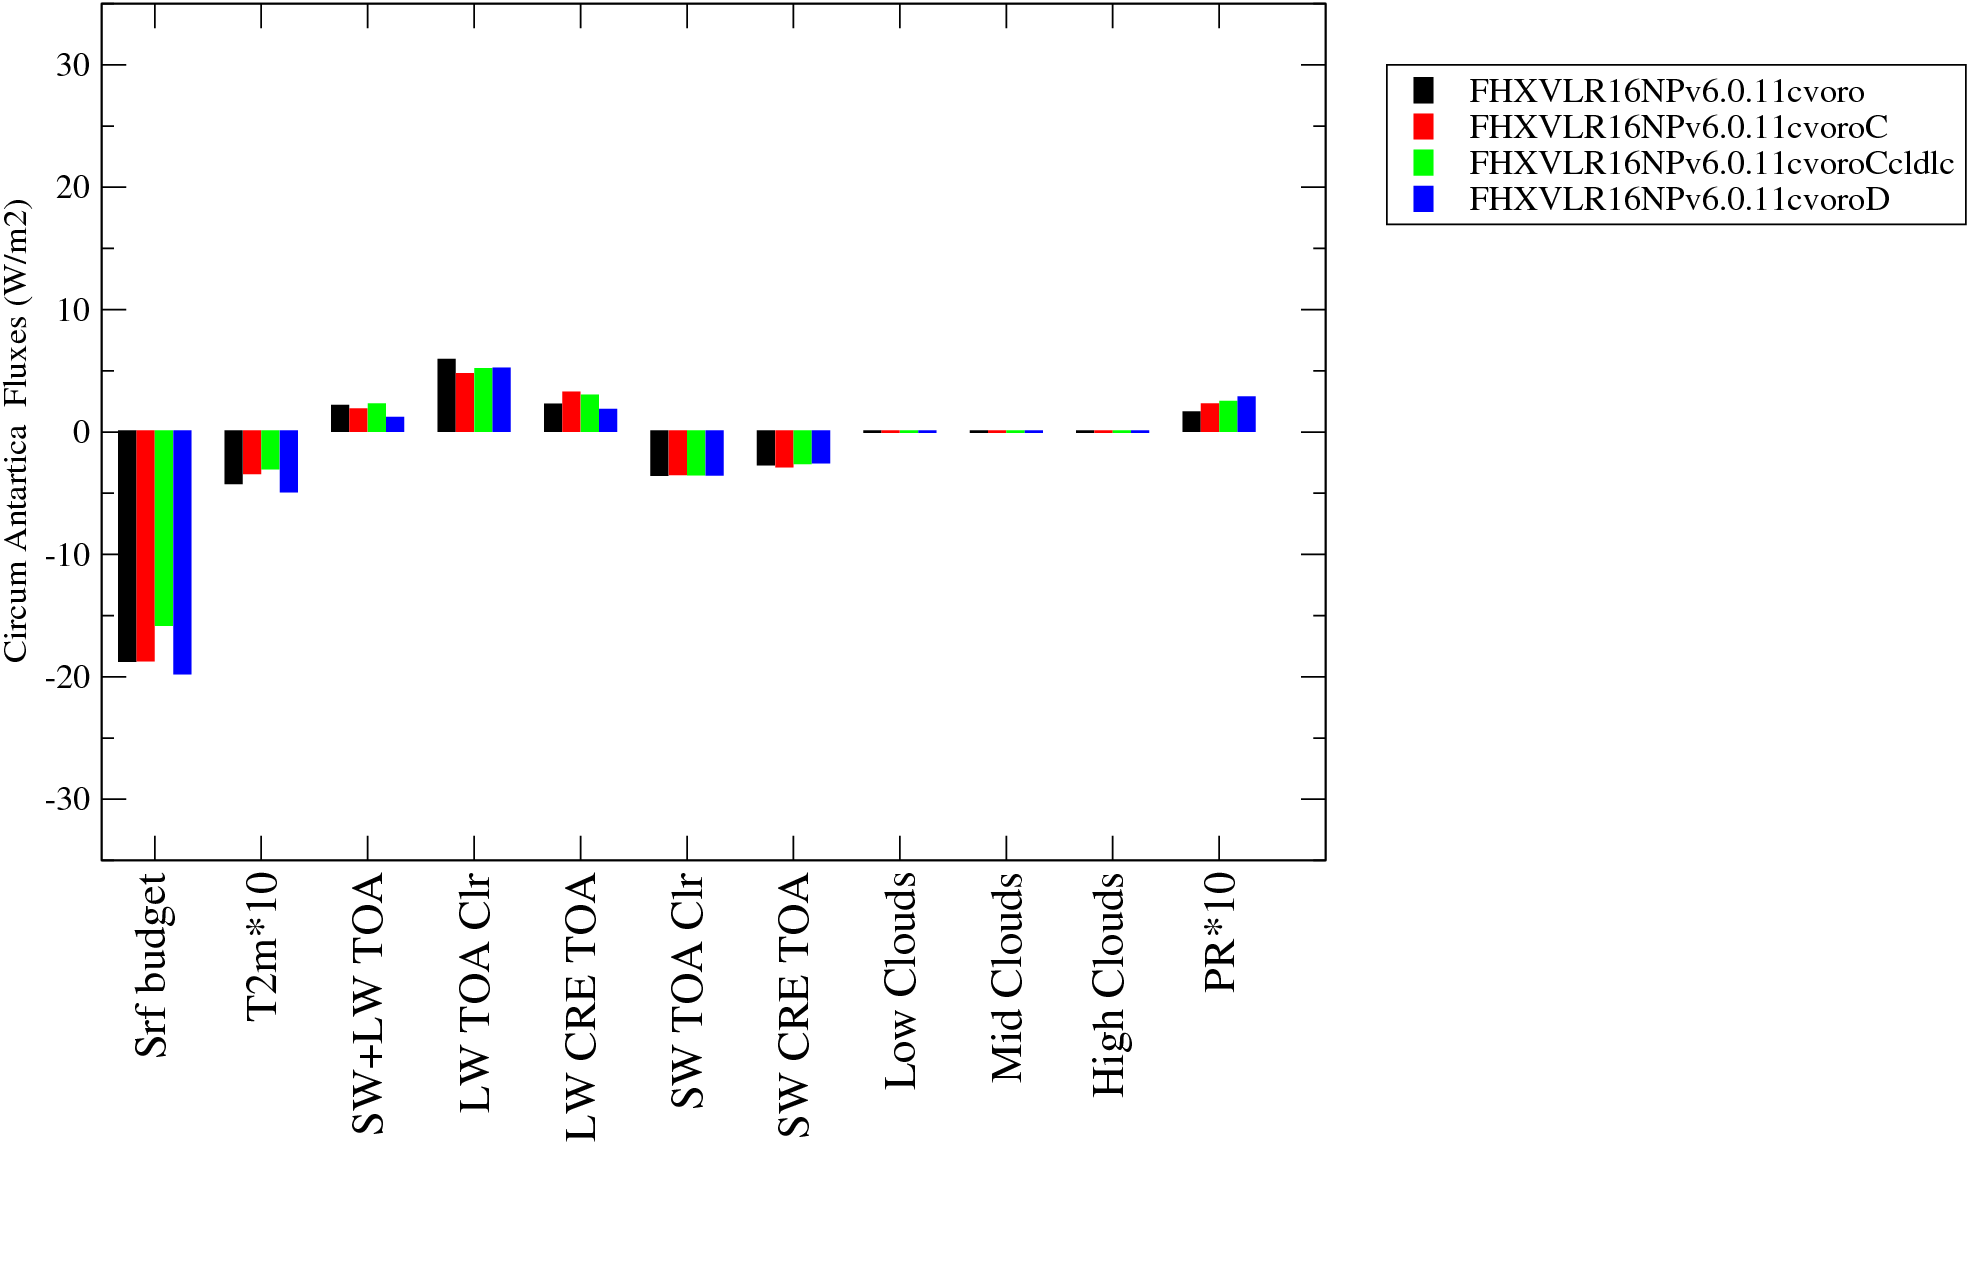
| Siberia | US gr. plains | Arctic | N. Atlantic | Circum Antart. |
 |
 |
 |
 |
 |
 |
 |
 |
 |
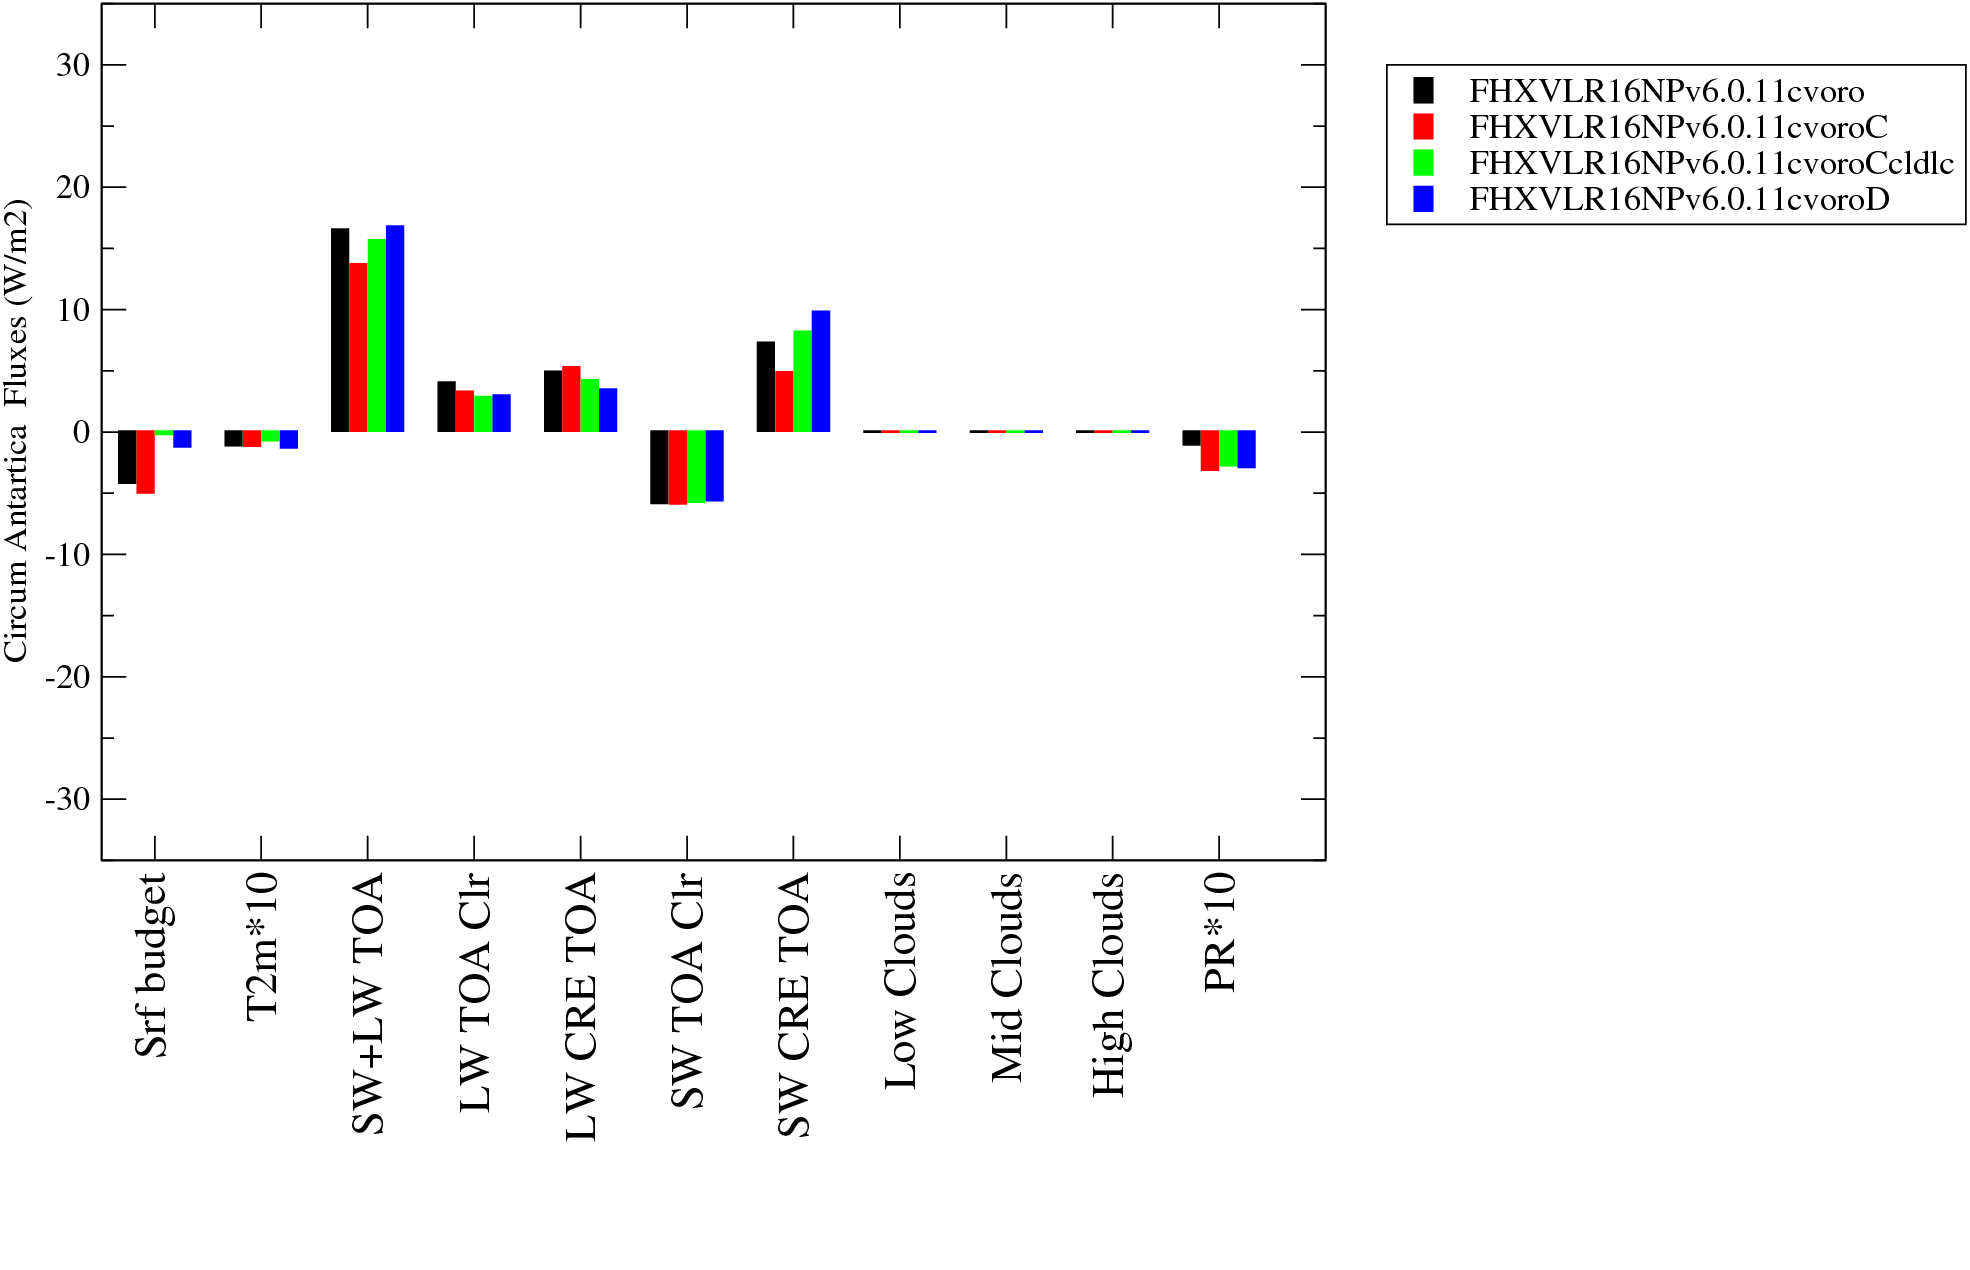 |
| Siberia | US gr. plains | Arctic | N. Atlantic | Circum Antart. |
 |
 |
 |
 |
 |
 |
 |
 |
 |
 |