






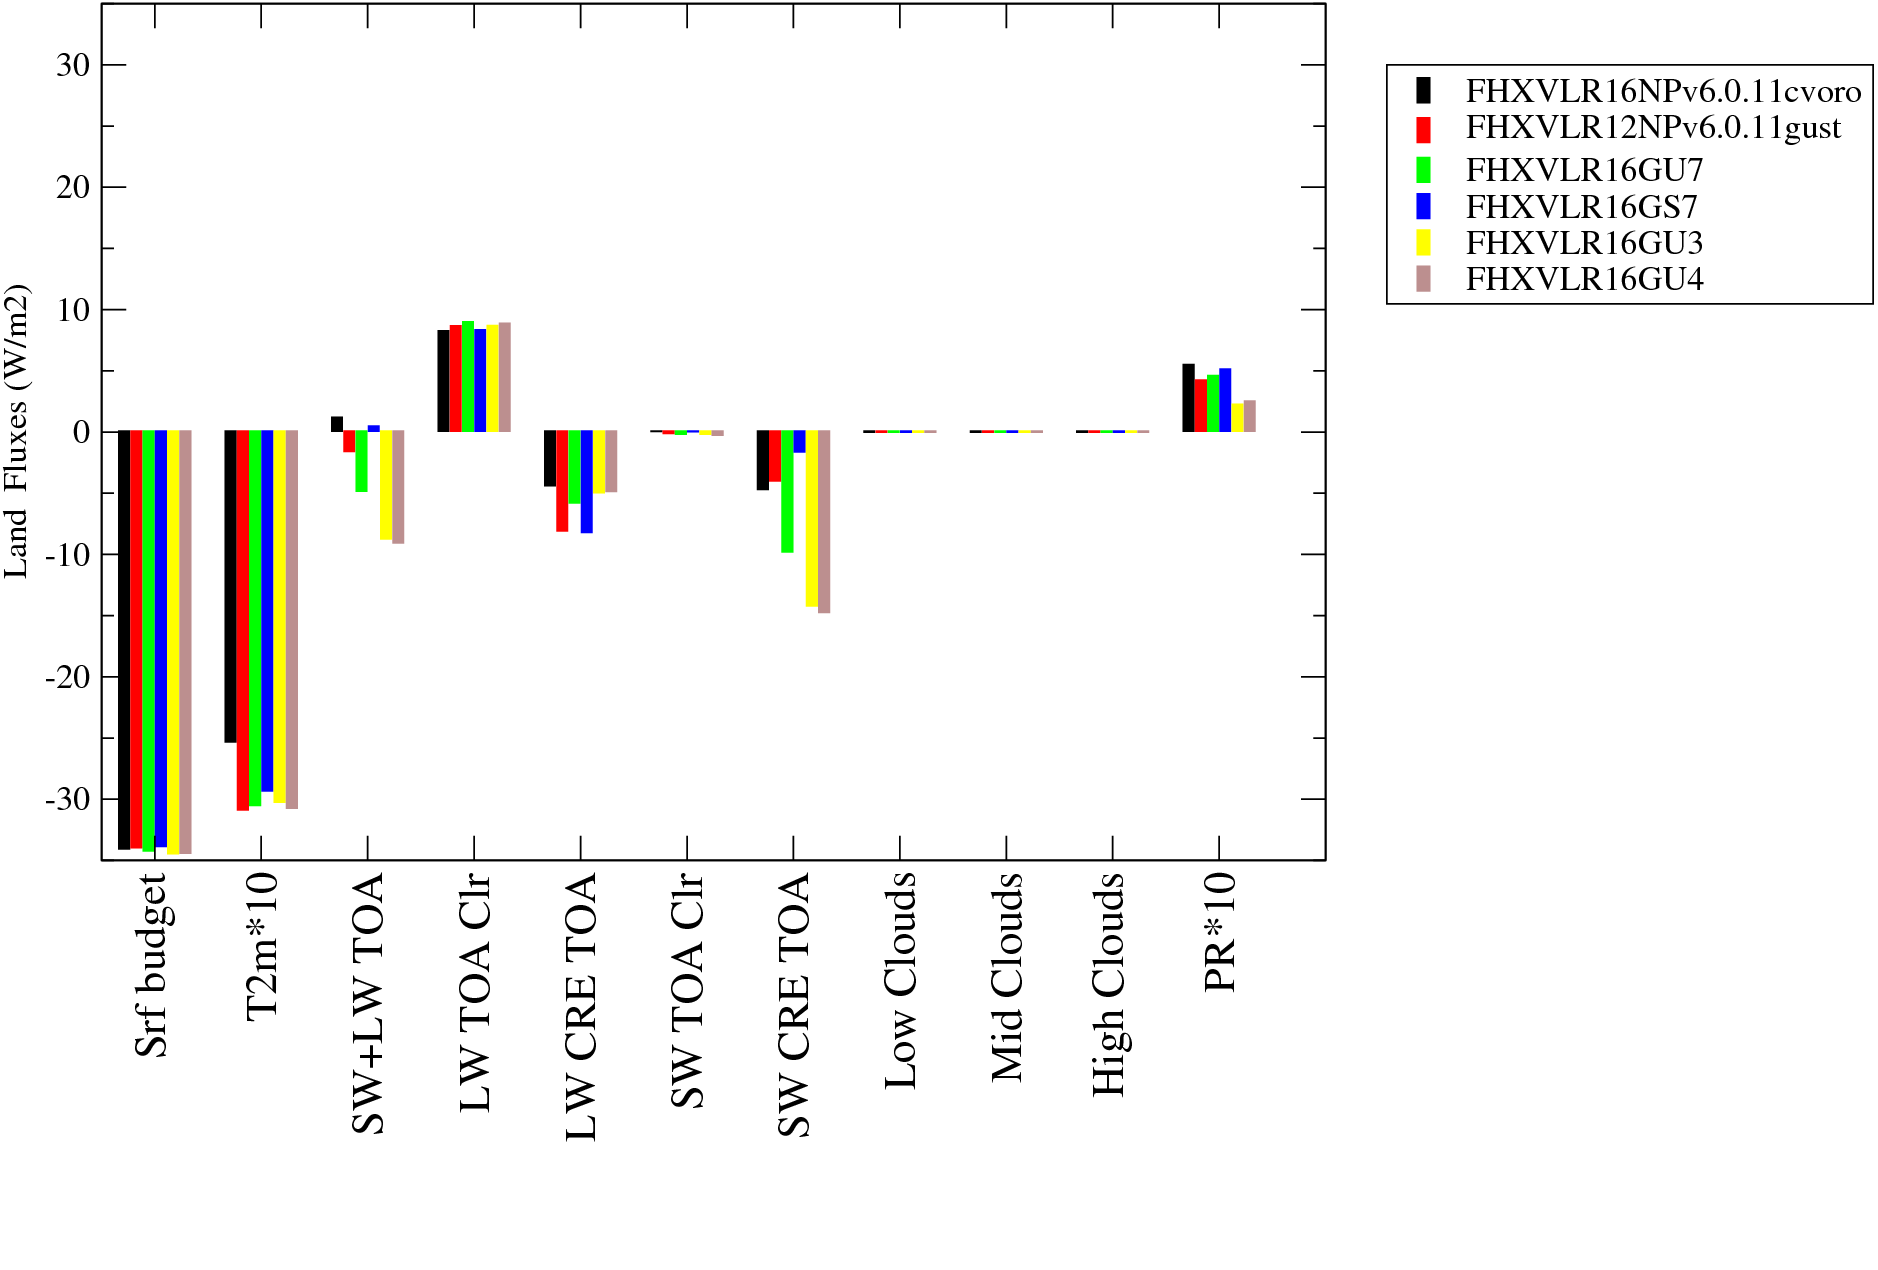


| RUN | Atlas YEAR | Atlas --DJF-- | Atlas --JJA-- | Description of the simulation _____________________ | Name | Period | bils | rt | rst | rlut | rlutcs | crest | crelt | cret | eva | pr | prw |
| CLIMATOS | 7.097 | 0.7823 | 240.4 | 239.6 | 269.4 | -47.05 | 29.84 | -17.21 | 3.415 | 2.61 | 27.46 | ||||||
| FHXVLR16NPv6.0.11cvoro | - - - | - - - | - - - | FHXXVLR16NPv6.0.11cvoro | 2005_2005 | FHXVLR16NPv6.0.11cvoro | 3.9209 | 2.738 | 236.498 | 233.76 | 258.681 | -48.6367 | 24.921 | -23.7157 | 3.04828 | 25.9592 | |
| FHXVLR12NPv6.0.11gust | - - - | - - - | - - - | NPv6.0.11gust | 2000_2000 | FHXVLR12NPv6.0.11gust | 2.3276 | 1.026 | 237.241 | 236.215 | 258.591 | -47.7202 | 22.376 | -25.3442 | 3.03344 | 26.0019 | |
| FHXVLR16GU7 | - - - | - - - | - - - | FHXXVLR16GU7 | 2005_2005 | FHXVLR16GU7 | -4.3569 | -5.736 | 226.836 | 232.572 | 258.449 | -58.0914 | 25.877 | -32.2144 | 3.09443 | 26.0226 | |
| FHXVLR16GS7 | - - - | - - - | - - - | FHXXVLR16GS7 | 2005_2005 | FHXVLR16GS7 | 3.4425 | 2.002 | 238.229 | 236.227 | 258.664 | -46.7446 | 22.437 | -24.3076 | 3.02253 | 26.0358 | |
| FHXVLR16GU3 | - - - | - - - | - - - | FHXXVLR16GU3 | 2005_2005 | FHXVLR16GU3 | -9.482 | -10.799 | 220.492 | 231.291 | 258.385 | -64.4812 | 27.094 | -37.3872 | 3.0714 | 25.8375 | |
| FHXVLR16GU4 | - - - | - - - | - - - | FHXXVLR16GU4 | 2005_2005 | FHXVLR16GU4 | -9.7307 | -11.11 | 219.767 | 230.877 | 258.373 | -65.1849 | 27.496 | -37.6889 | 3.08012 | 25.8045 | |
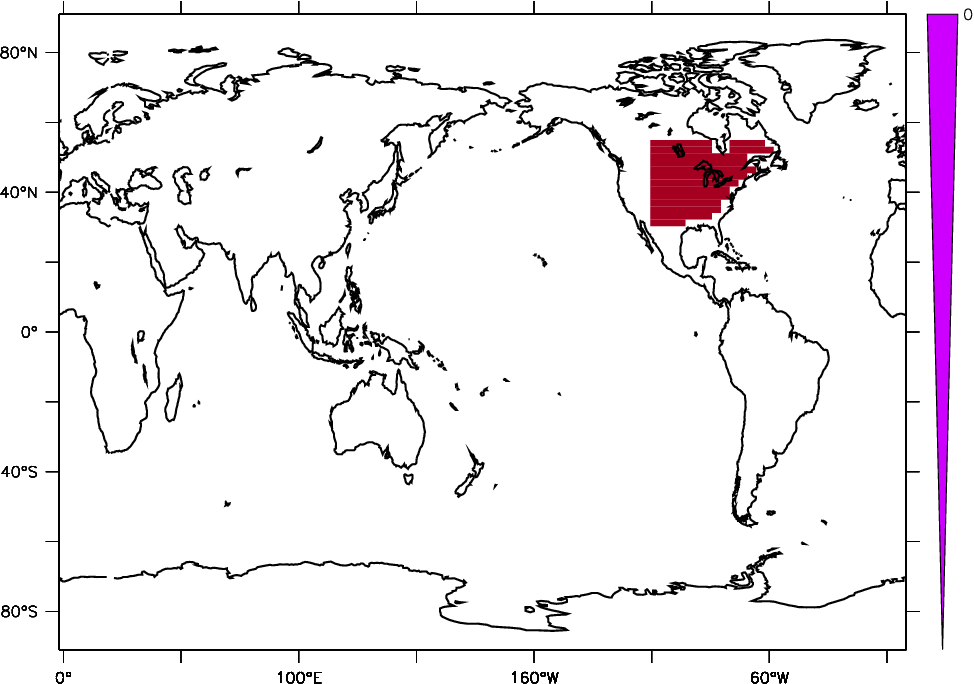
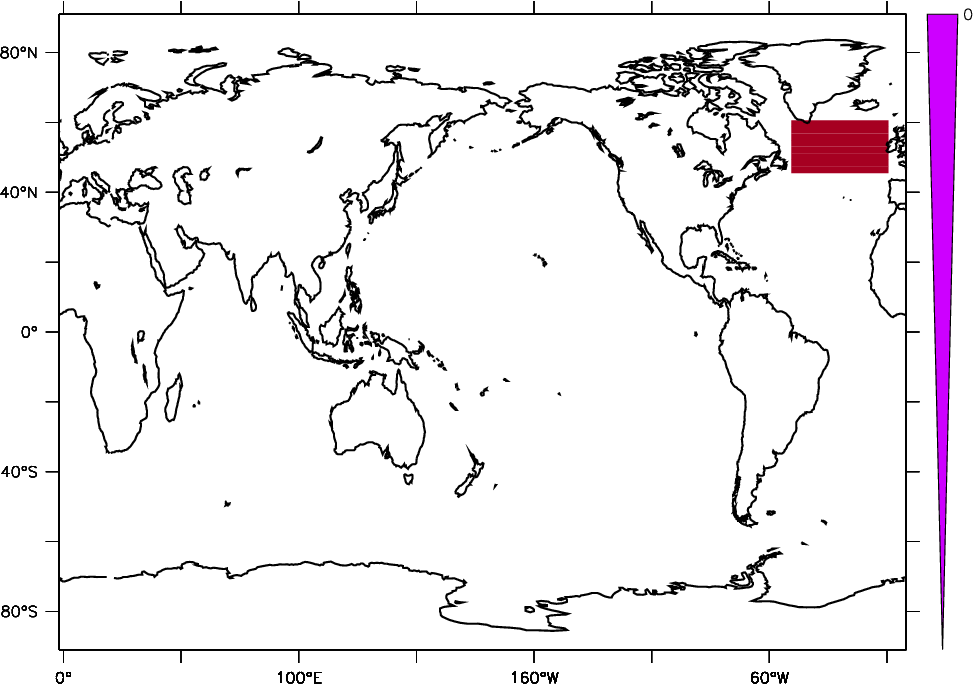
| Siberia | US gr. plains | Arctic | N. Atlantic | Circum Antart. |
 |
 |
 |
 |
 |
 |
 |
 |
 |
 |
| Siberia | US gr. plains | Arctic | N. Atlantic | Circum Antart. |
 |
 |
 |
 |
 |
 |
 |
 |
 |
 |