




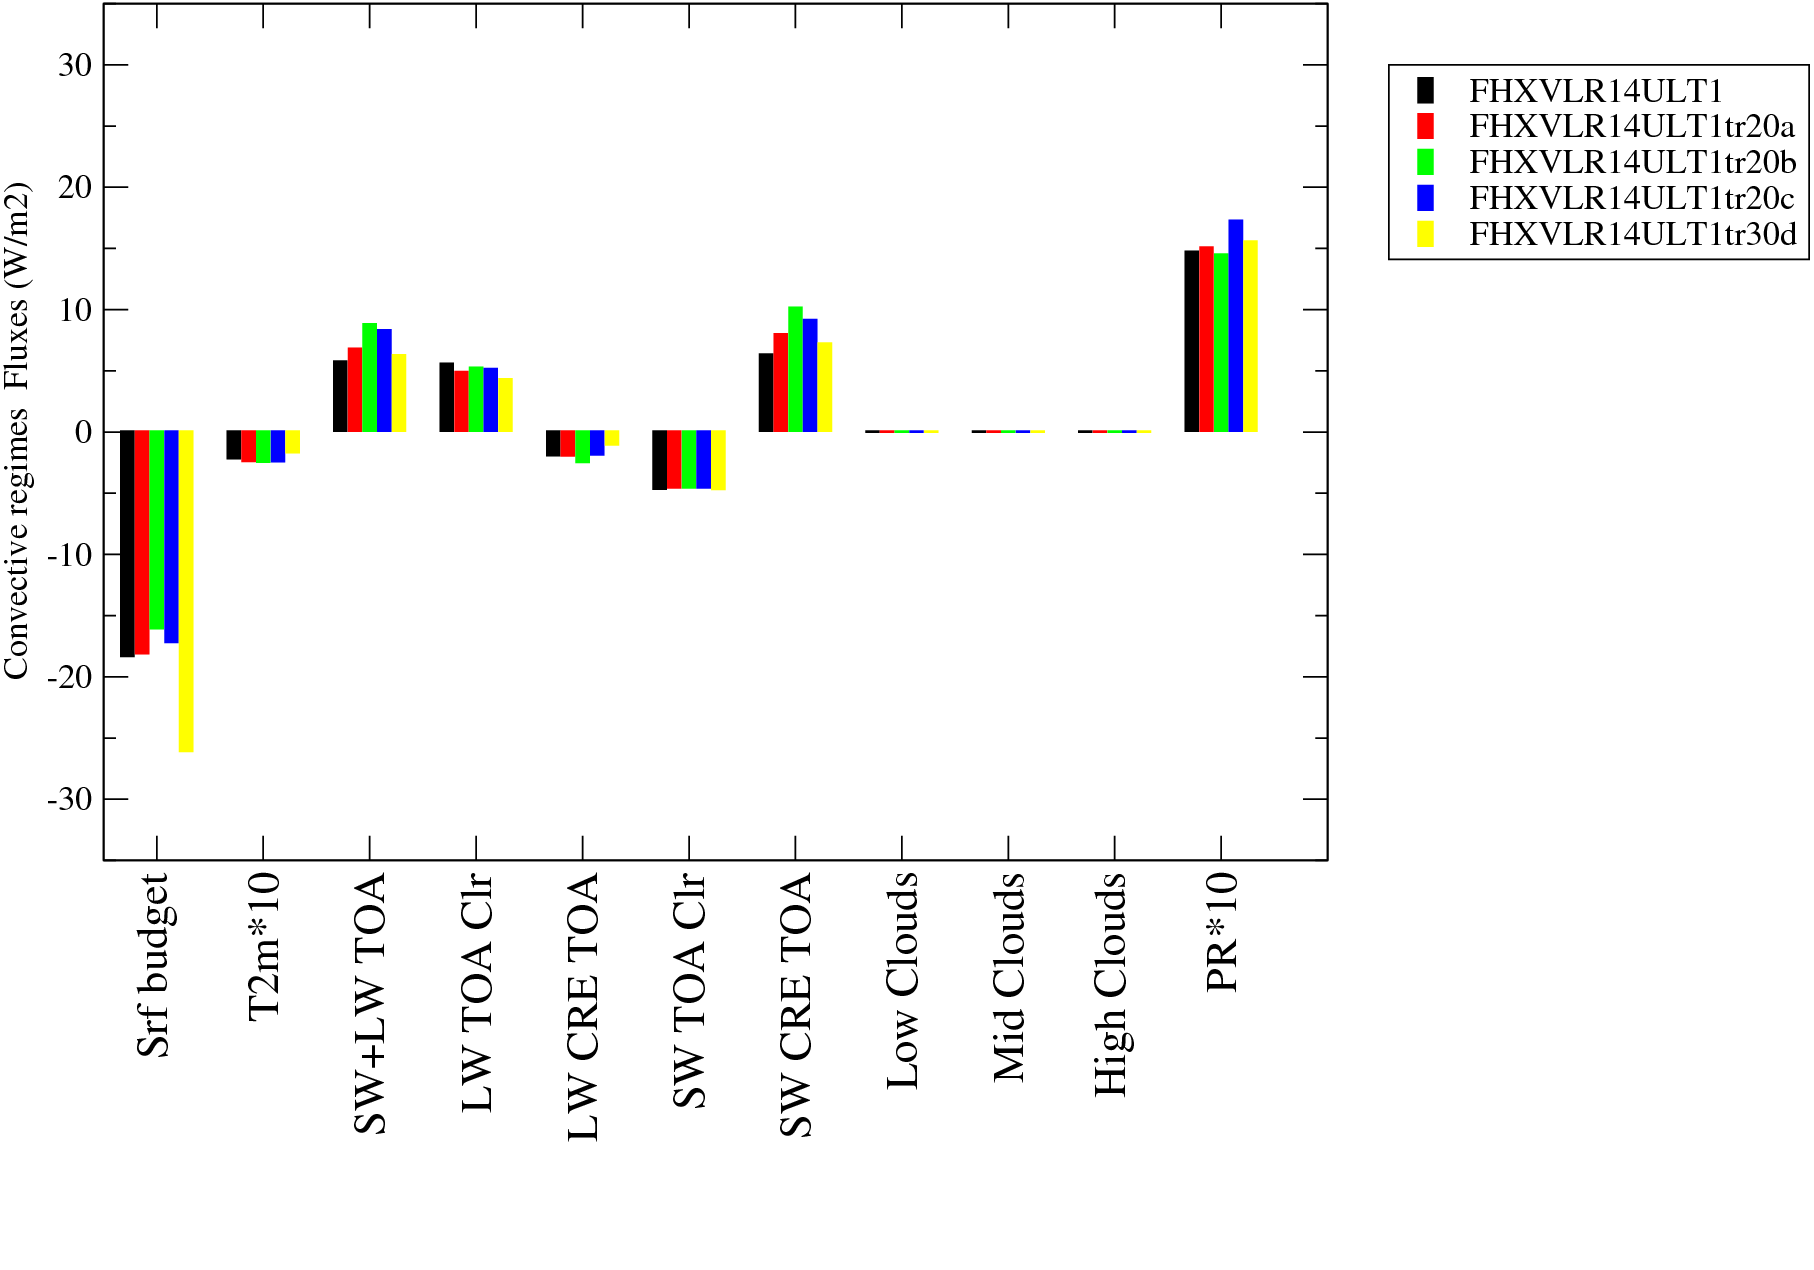





| RUN | Atlas YEAR | Atlas --DJF-- | Atlas --JJA-- | Description of the simulation ______________________ | Name | Period | bils | rt | rst | rlut | rlutcs | crest | crelt | cret | eva | pr | prw |
| CLIMATOS | 7.097 | 0.7823 | 240.4 | 239.6 | 269.4 | -47.05 | 29.84 | -17.21 | 3.415 | 2.61 | 27.46 | ||||||
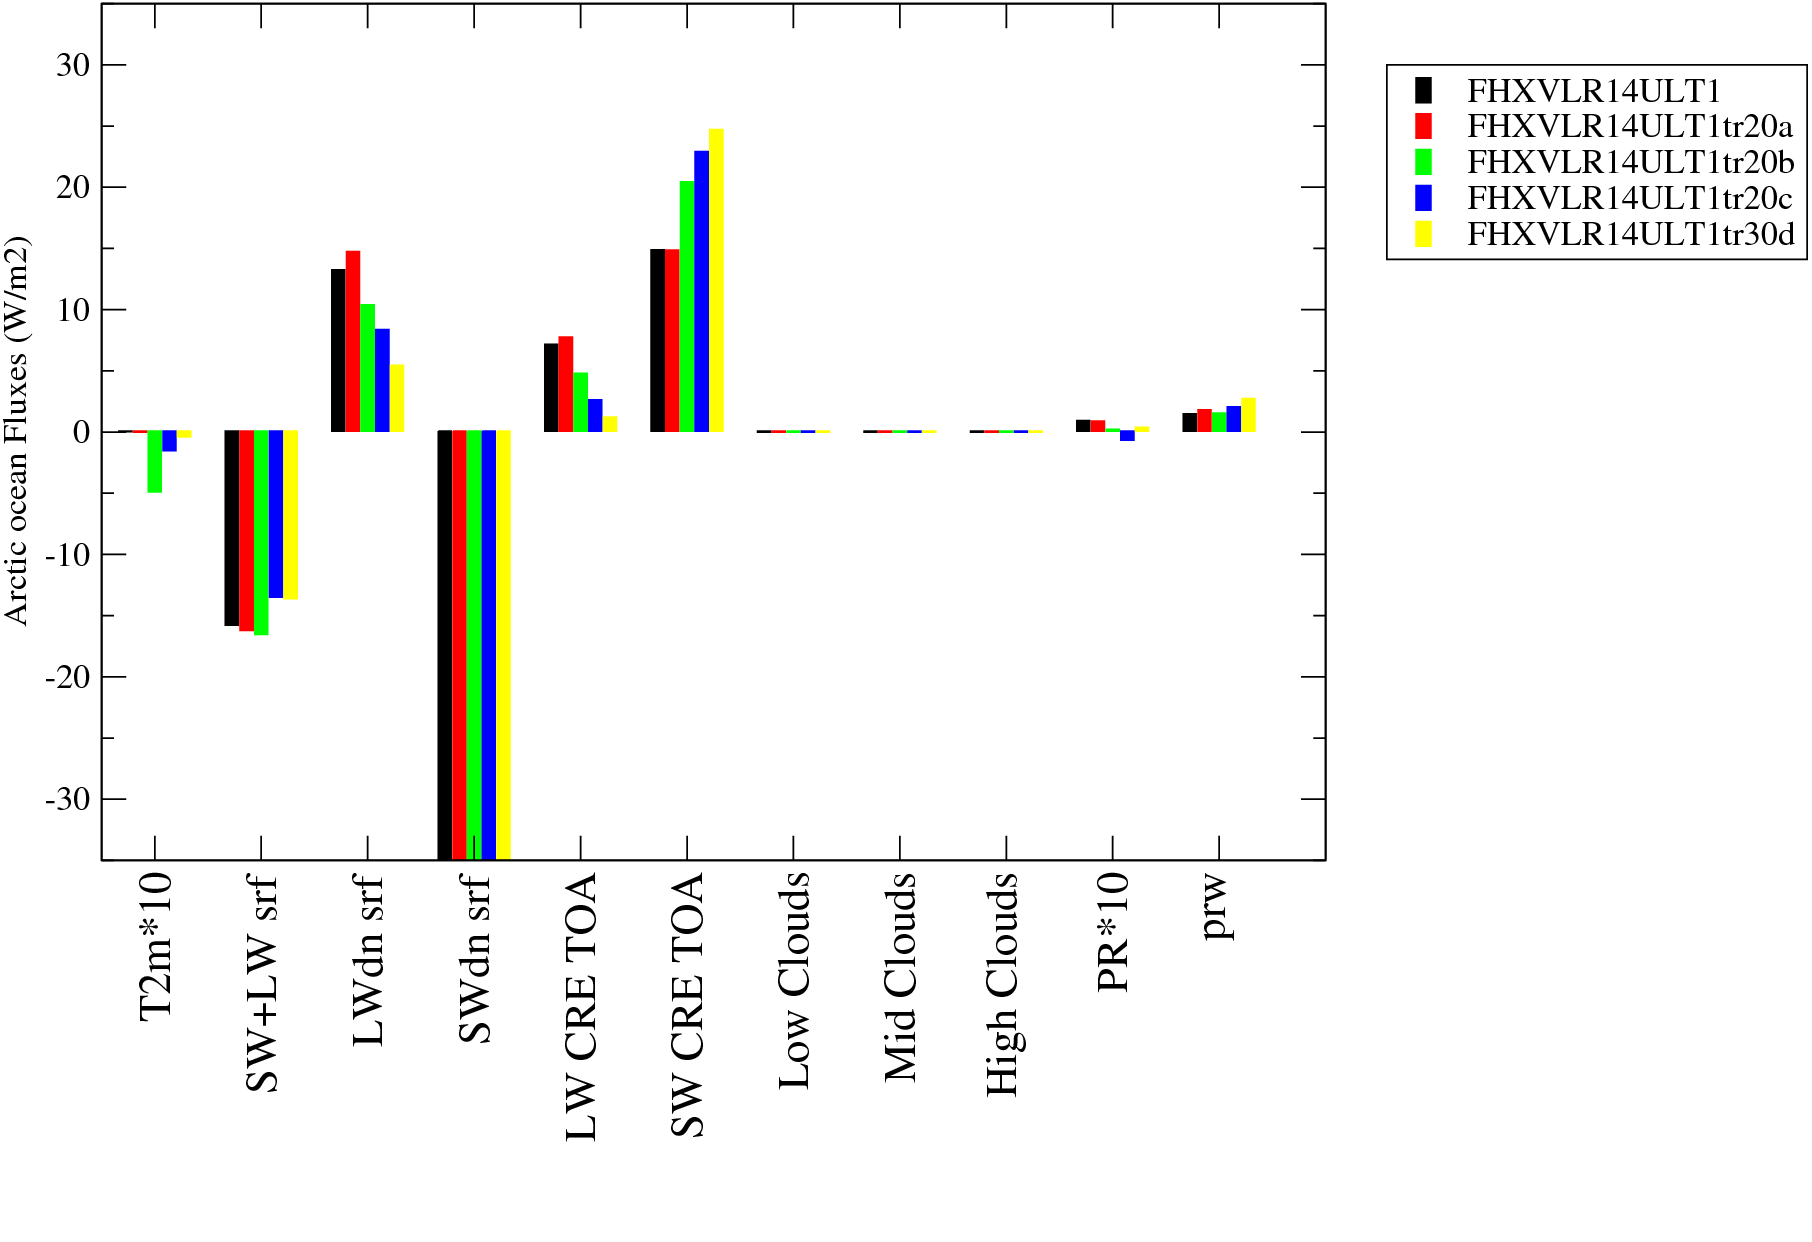
| FHXVLR14ULT1 | - - - | - - - | - - - | FHXVLR14ULT1 | 2006_2006 | FHXVLR14ULT1 | 4.1009 | 2.843 | 236.683 | 233.84 | 258.748 | -48.542 | 24.908 | -23.634 | 3.05111 | 25.7183 | |
| FHXVLR14ULT1tr20a | - - - | - - - | - - - | FHXVLR14ULT1tr20a | 2006_2006 | FHXVLR14ULT1tr20a | 0.7296 | 0.067 | 232.646 | 232.579 | 258.672 | -52.2366 | 26.093 | -26.1436 | 3.00738 | 25.5724 | |
| FHXVLR14ULT1tr20b | - - - | - - - | - - - | FHXVLR14ULT1tr20b | 2006_2006 | FHXVLR14ULT1tr20b | 2.9488 | 2.139 | 235.8 | 233.661 | 258.876 | -49.0598 | 25.215 | -23.8448 | 3.01241 | 25.6807 | |
| FHXVLR14ULT1tr20c | - - - | - - - | - - - | FHXVLR14ULT1tr20c | 2006_2006 | FHXVLR14ULT1tr20c | 4.3468 | 3.753 | 238.337 | 234.584 | 258.993 | -46.5606 | 24.409 | -22.1516 | 3.01132 | 25.6172 | |
| FHXVLR14ULT1tr30d | - - - | - - - | - - - | FHXVLR14ULT1tr30d | 2006_2006 | FHXVLR14ULT1tr30d | 3.0085 | 2.281 | 237.998 | 235.717 | 259.296 | -46.9551 | 23.579 | -23.3761 | 2.97516 | 25.6281 | |
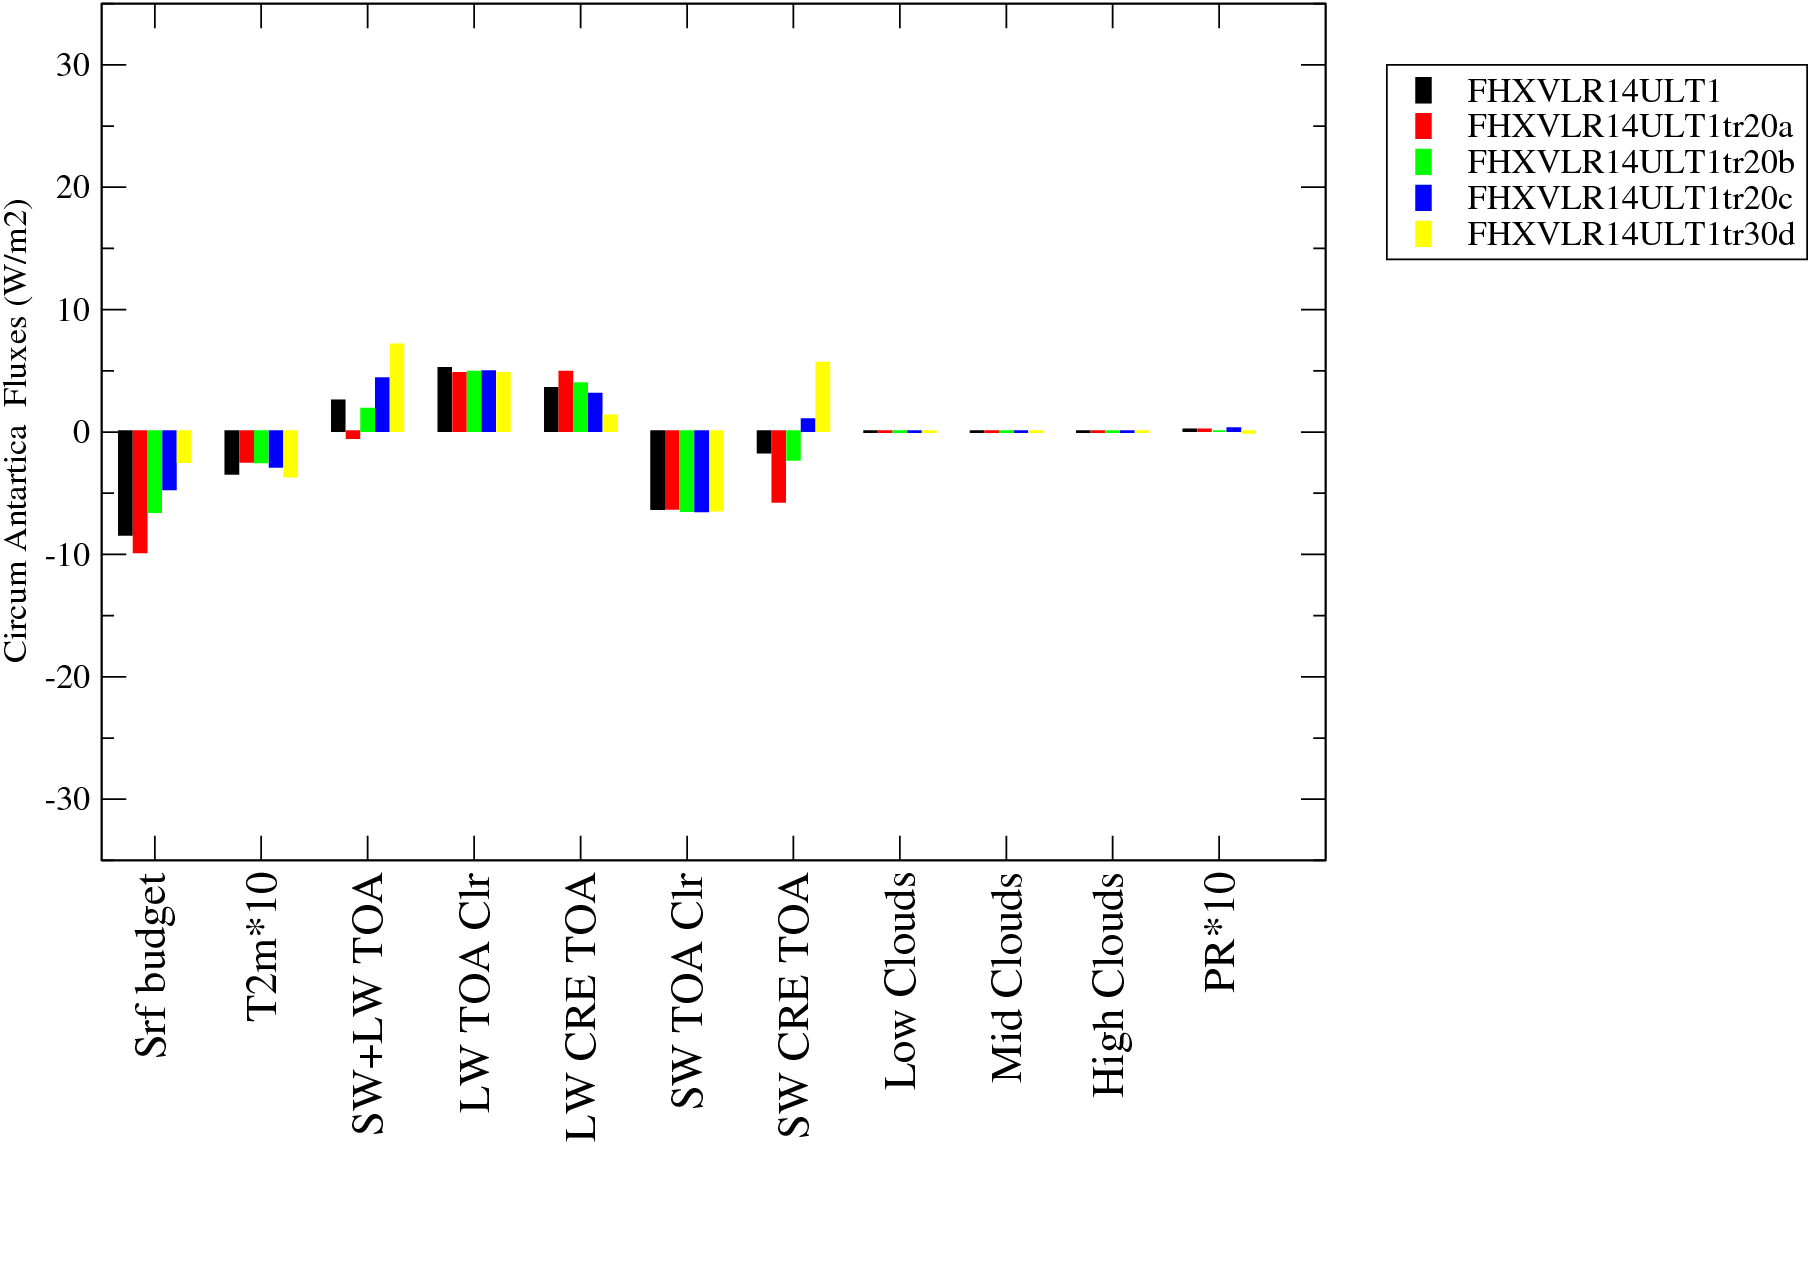
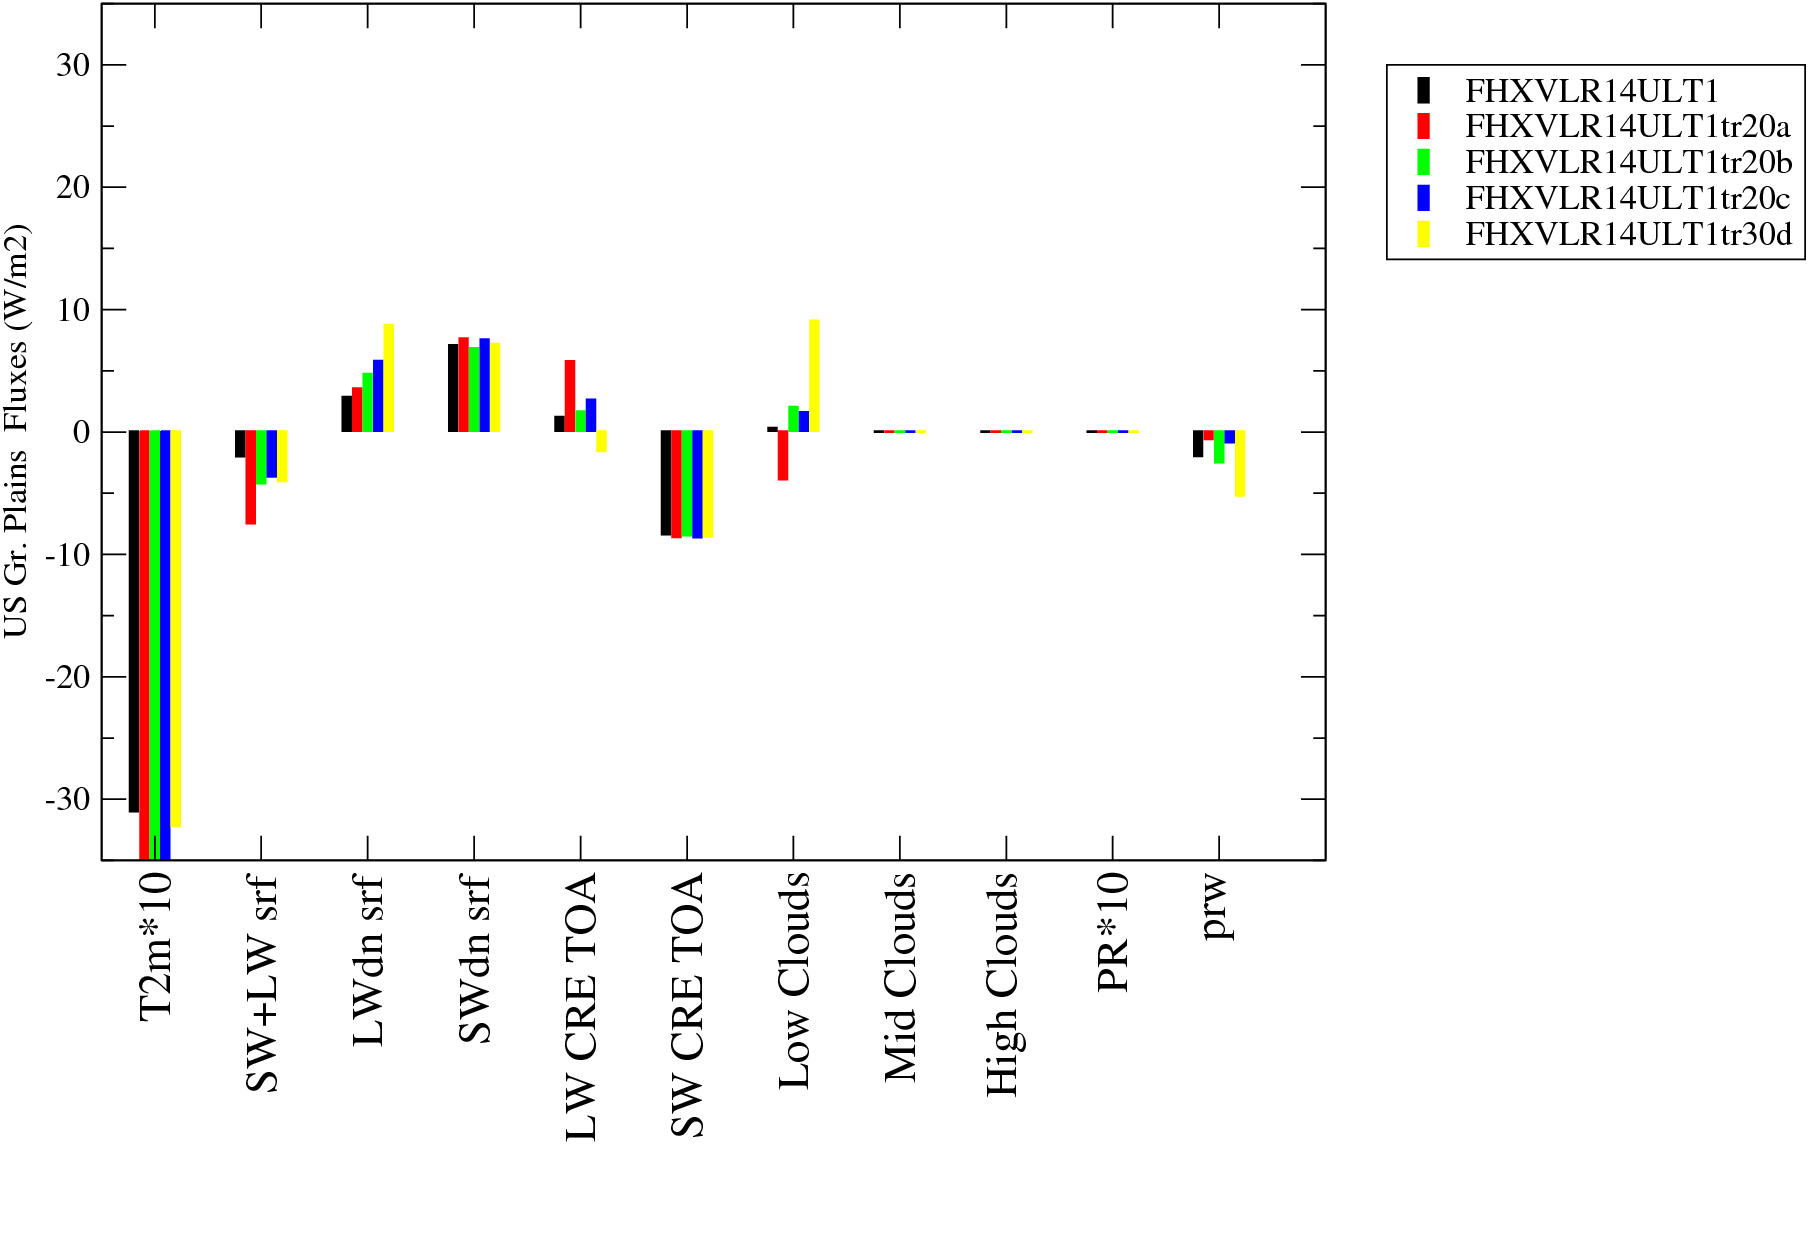
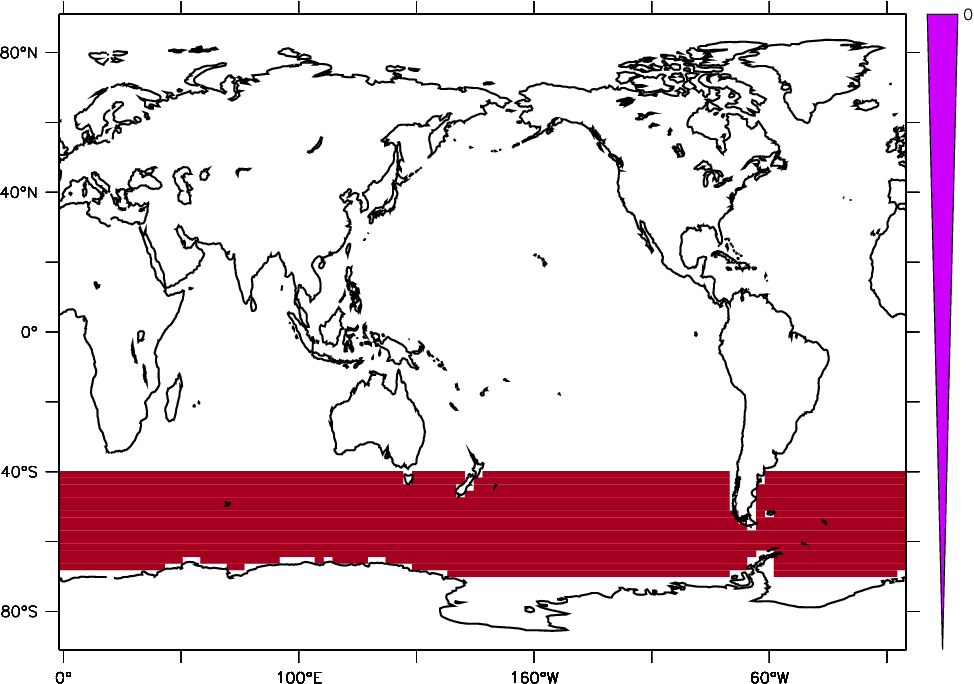
| Siberia | US gr. plains | Arctic | N. Atlantic | Circum Antart. |
 |
 |
 |
 |
 |
 |
 |
 |
 |
 |
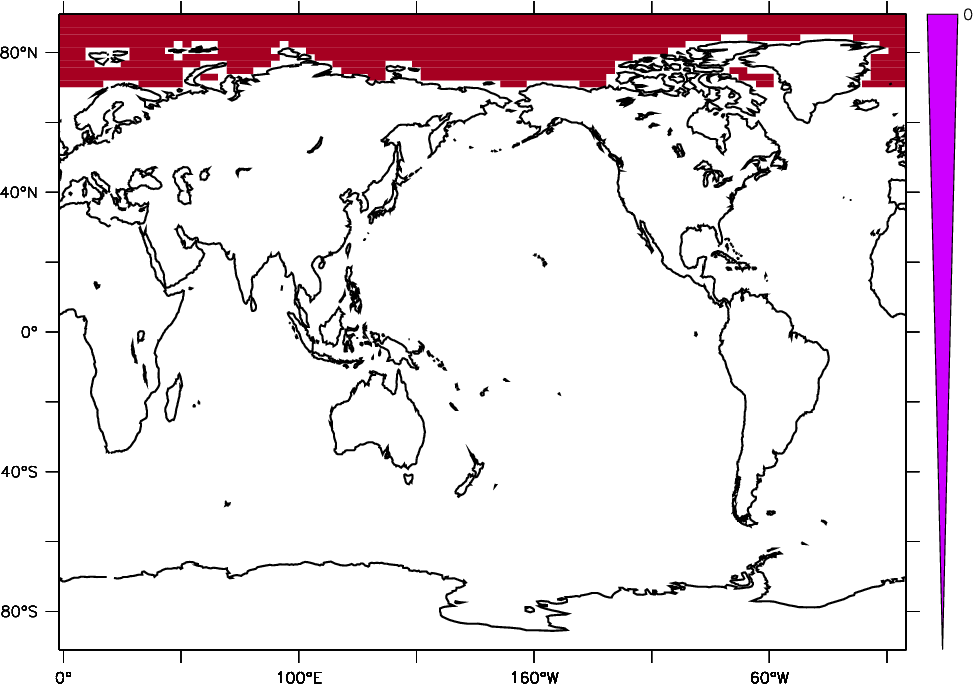
| Siberia | US gr. plains | Arctic | N. Atlantic | Circum Antart. |
 |
 |
 |
 |
 |
 |
 |
 |
 |
 |