


| RUN | Atlas YEAR | Atlas --DJF-- | Atlas --JJA-- | Description of the simulation ______________________ | Name | Period | bils | rt | rst | rlut | rlutcs | crest | crelt | cret | eva | pr | prw |
| CLIMATOS | 7.097 | 0.7823 | 240.4 | 239.6 | 269.4 | -47.05 | 29.84 | -17.21 | 3.415 | 2.61 | 27.46 | ||||||
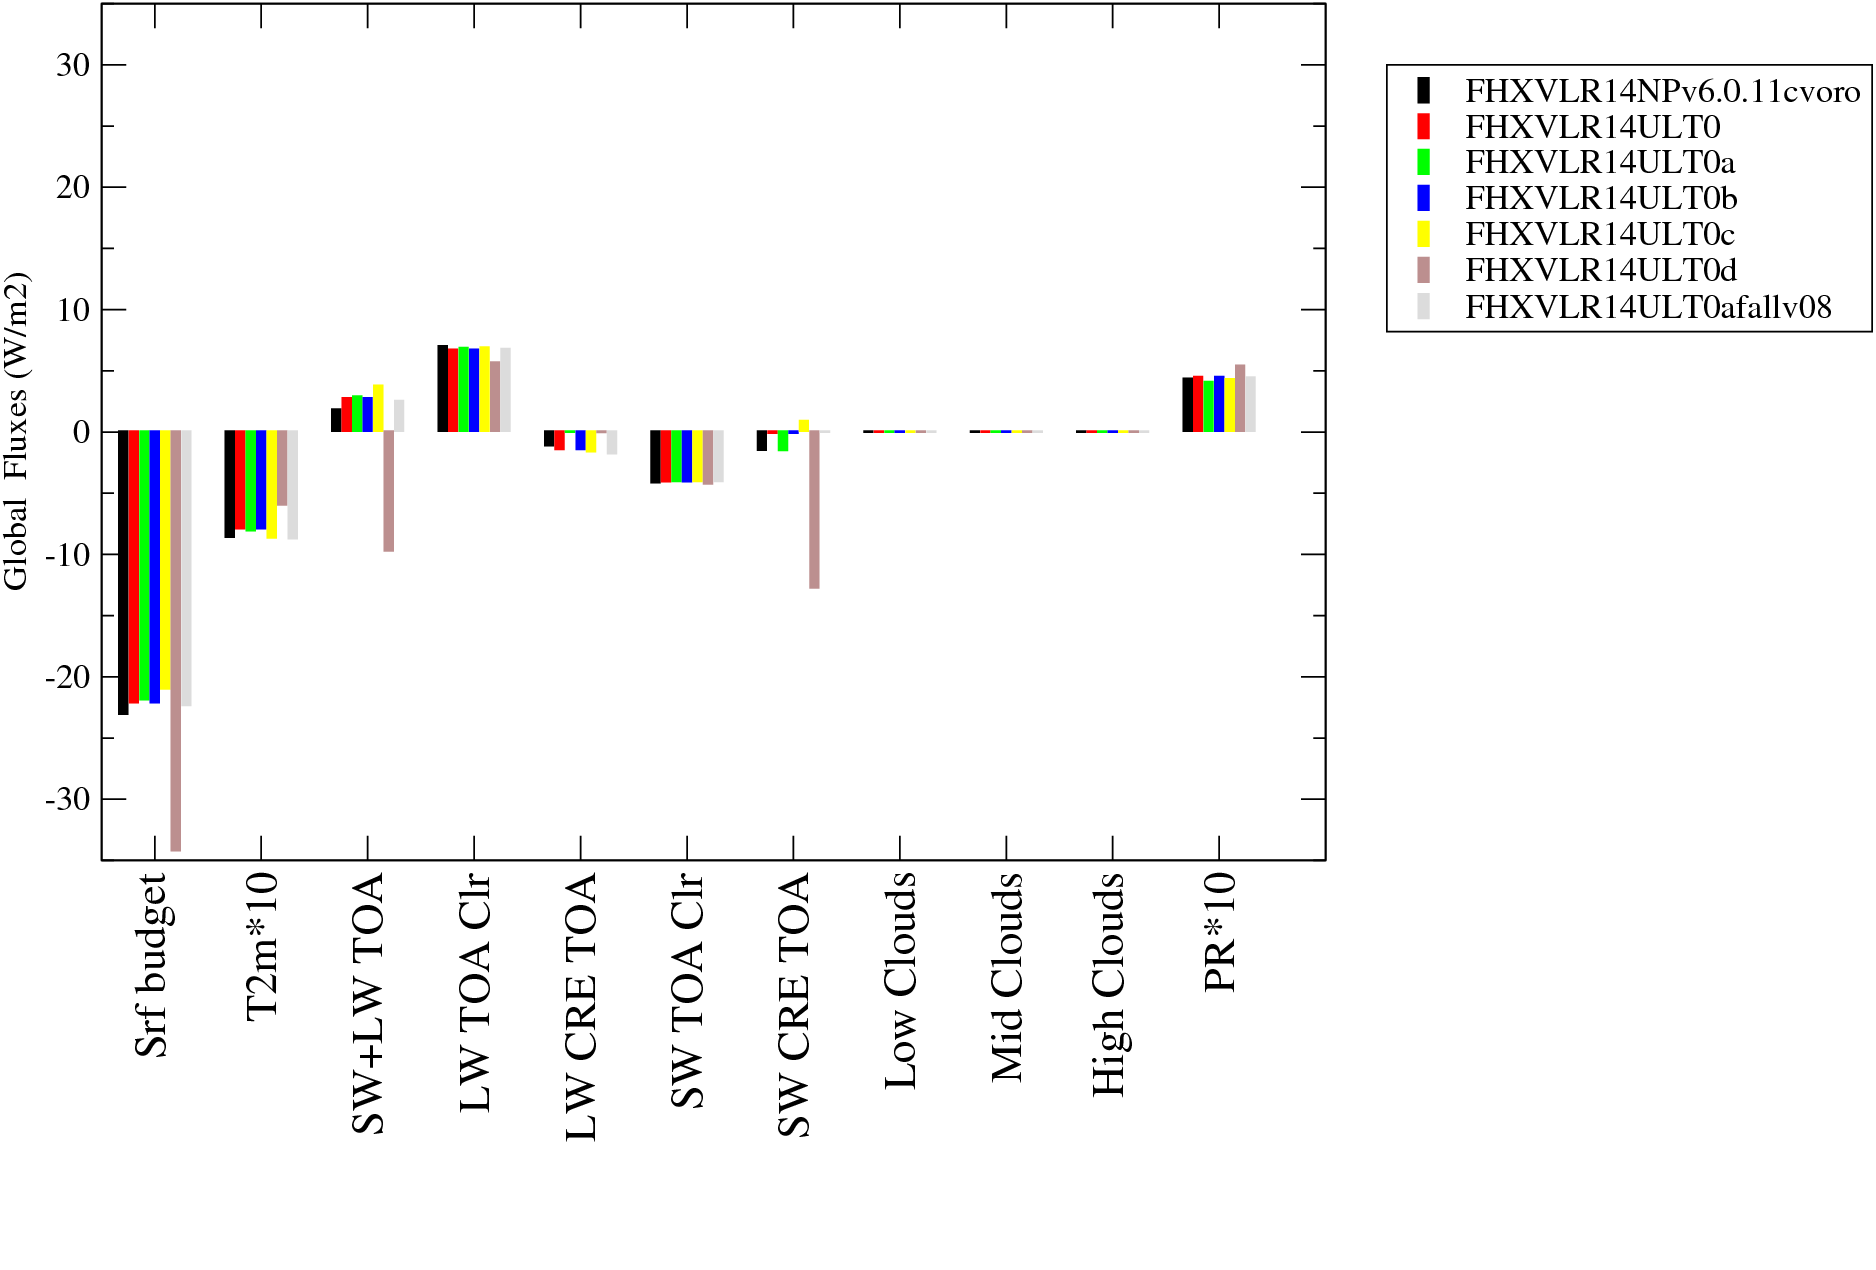
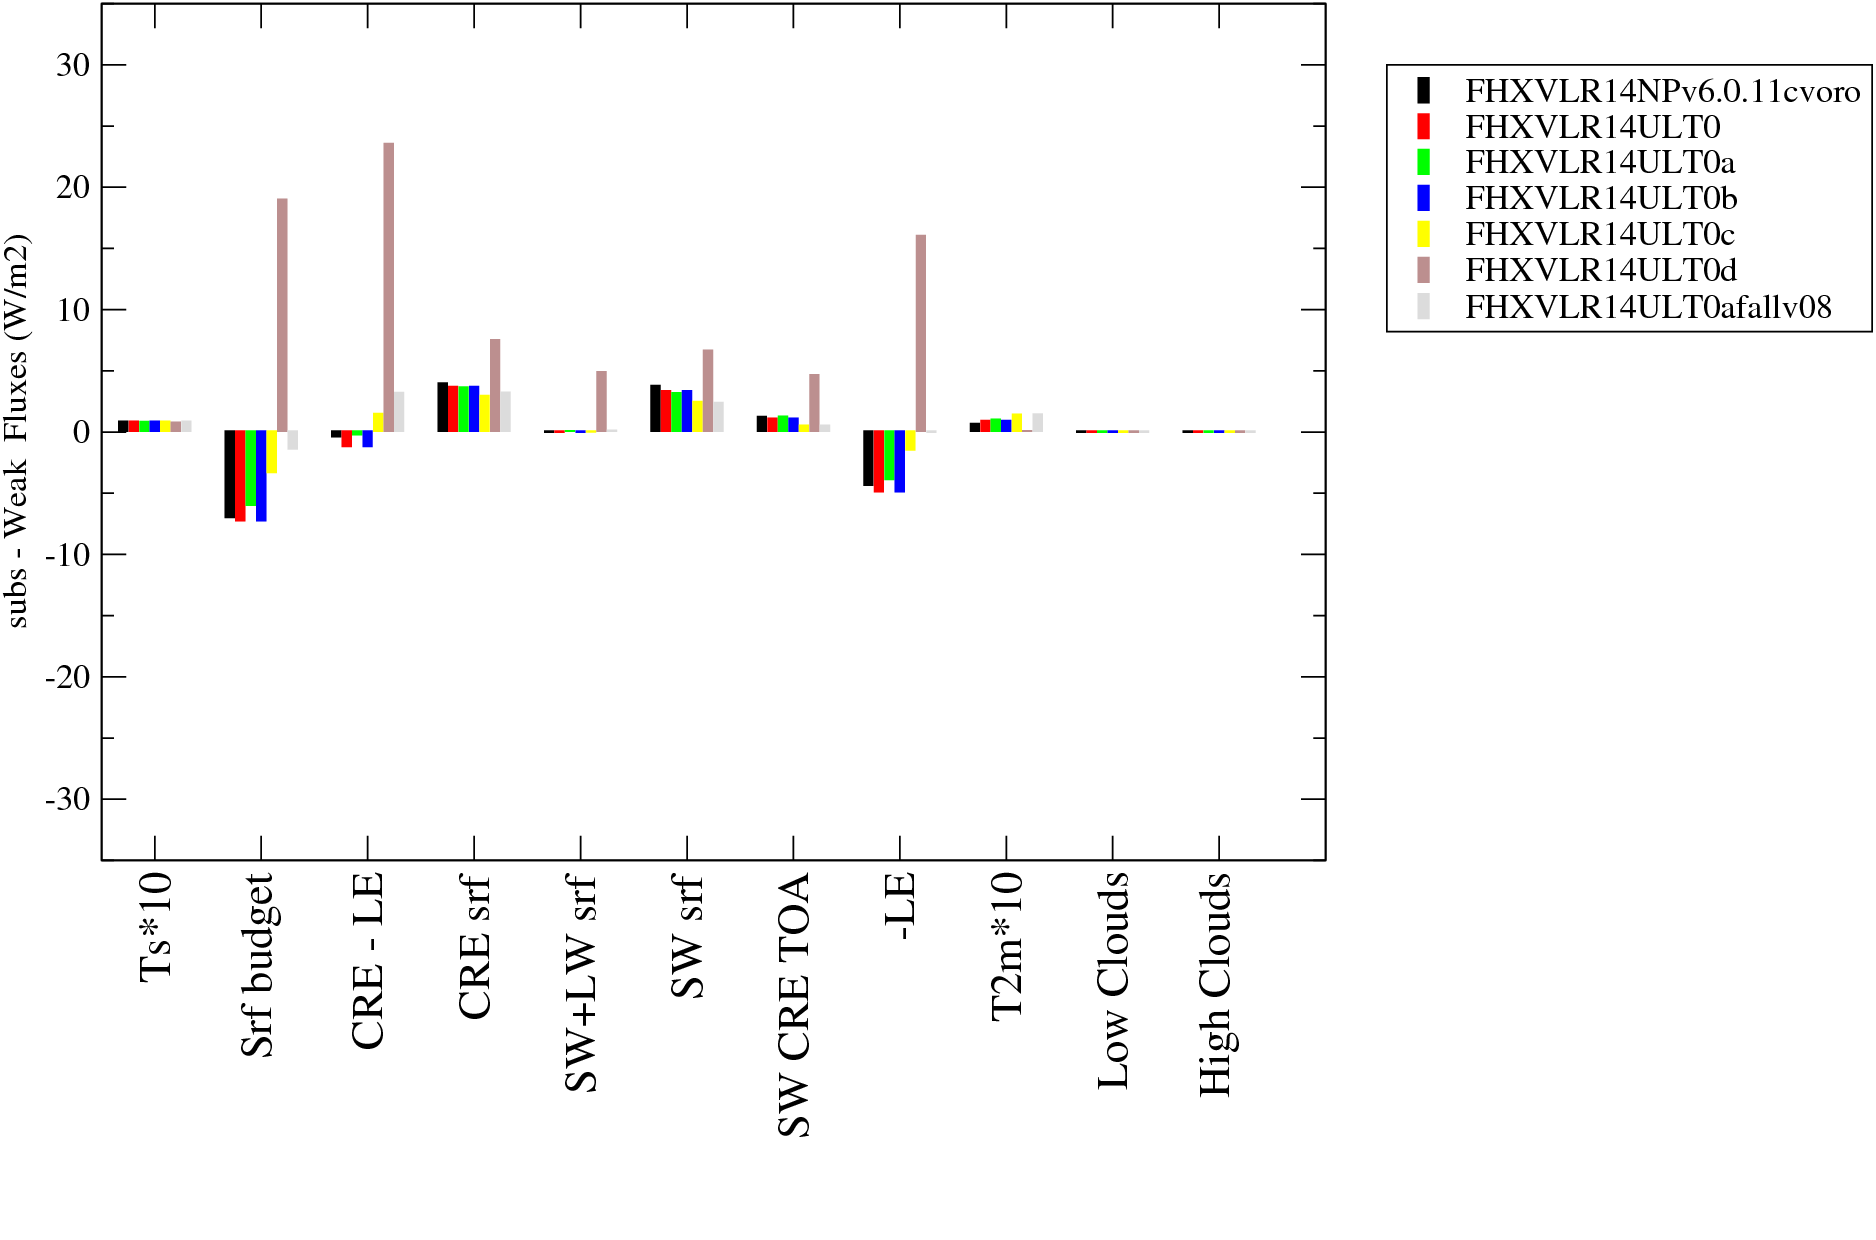
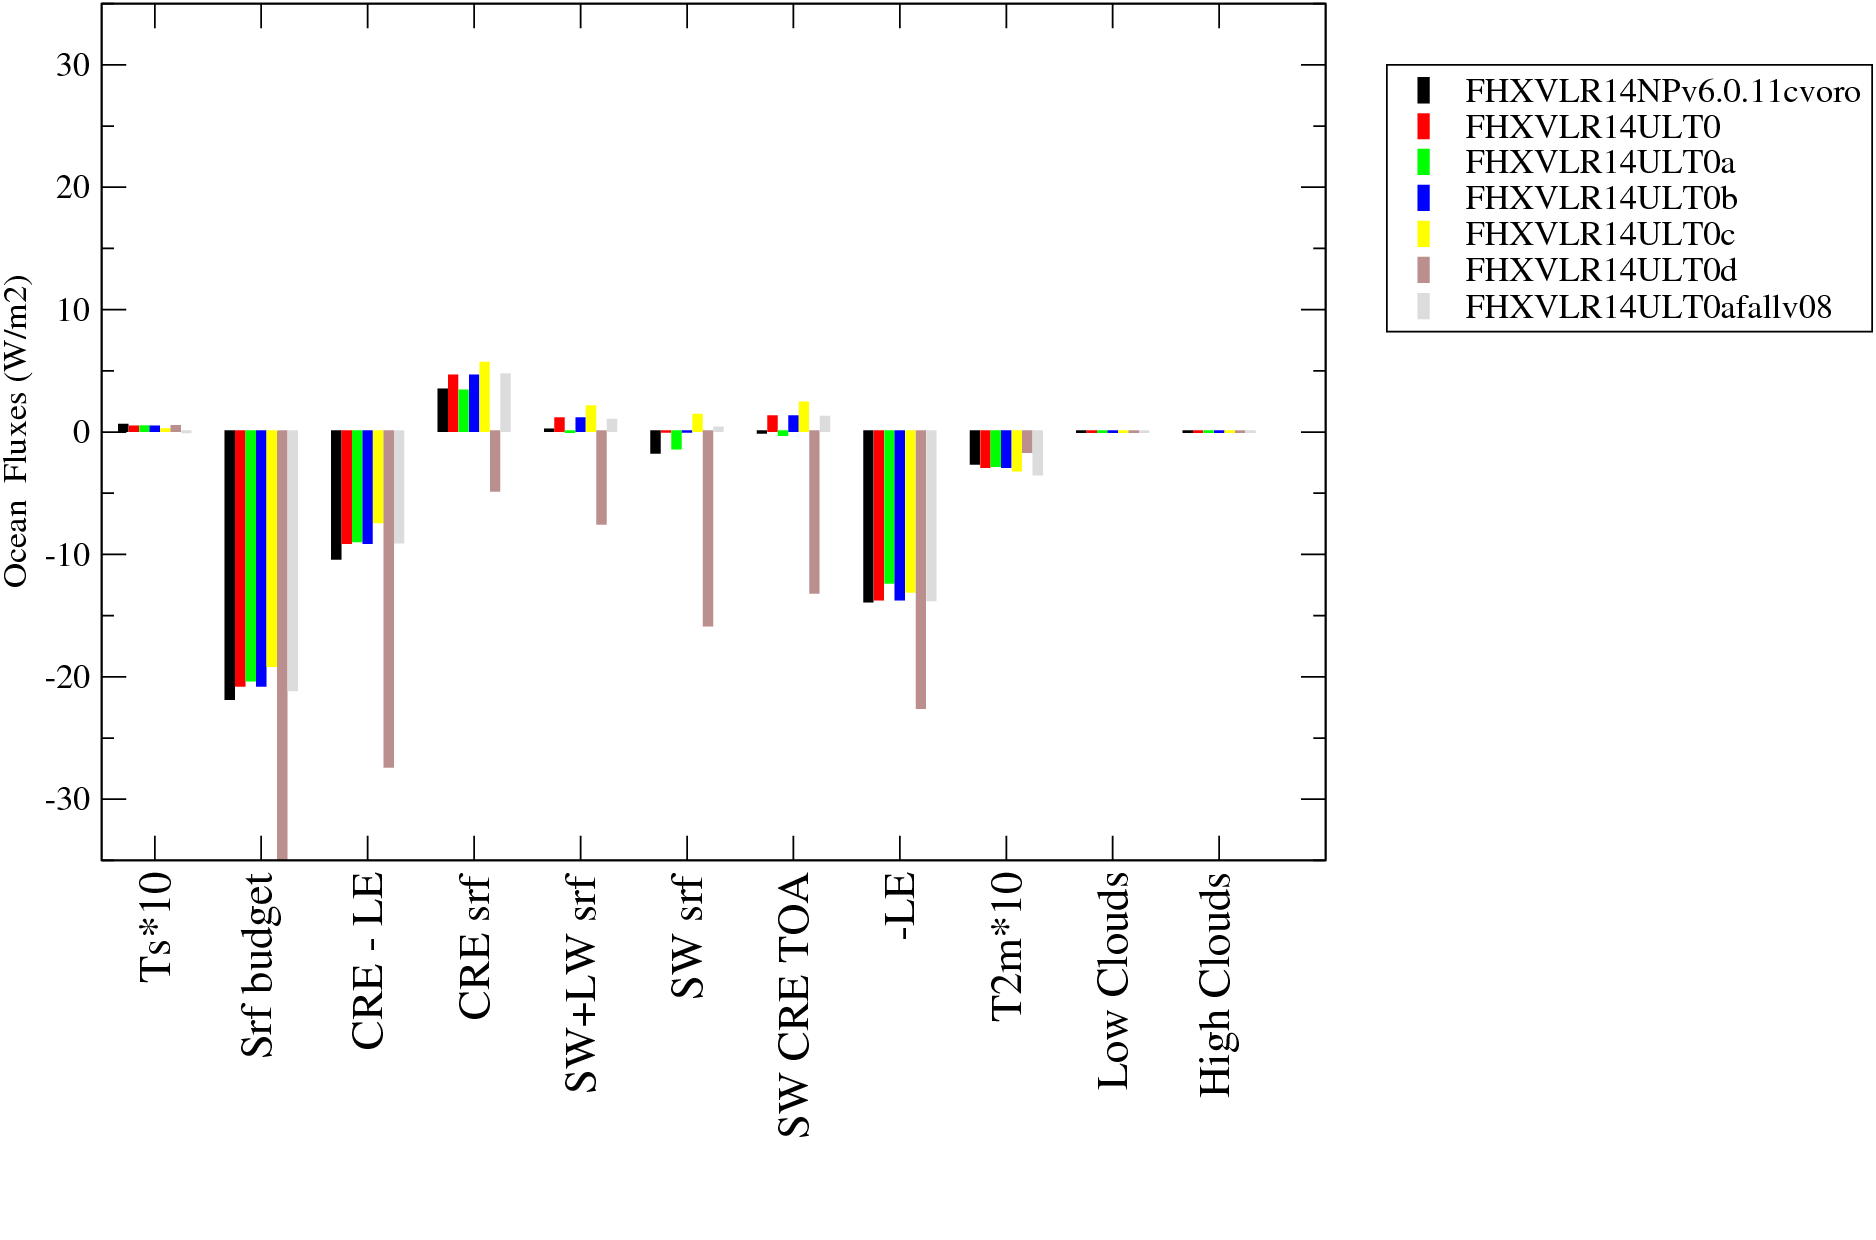
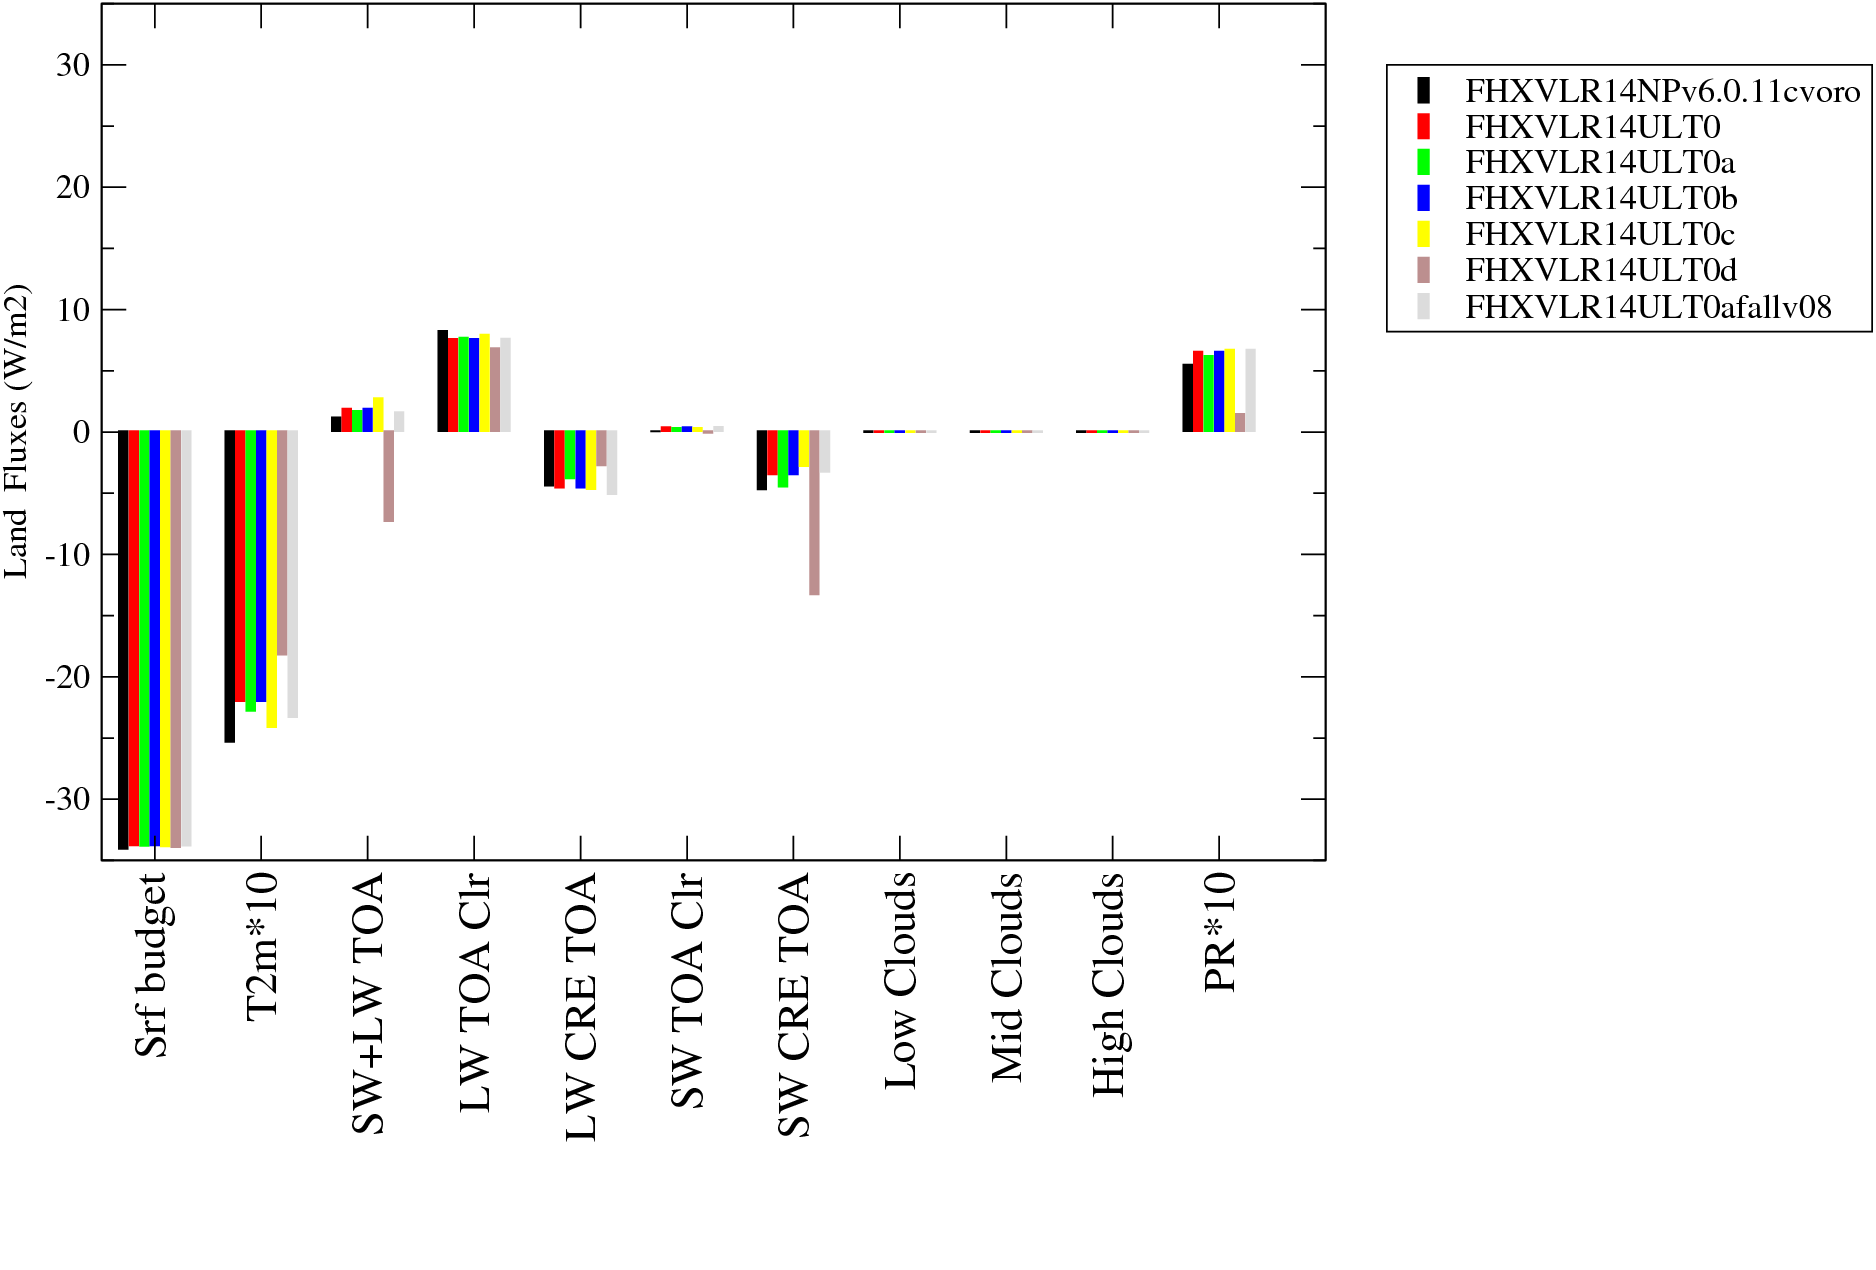
| FHXVLR14NPv6.0.11cvoro | - - - | - - - | - - - | FHXVLR14NPv6.0.11cvoro | 2005_2005 | FHXVLR14NPv6.0.11cvoro | 3.9209 | 2.738 | 236.498 | 233.76 | 258.681 | -48.6367 | 24.921 | -23.7157 | 3.04828 | 25.9592 | |
| FHXVLR14ULT0 | - - - | - - - | - - - | FHXVLR14ULT0 | 2005_2005 | FHXVLR14ULT0 | 4.8461 | 3.646 | 237.975 | 234.329 | 258.965 | -47.2558 | 24.636 | -22.6198 | 3.06267 | 25.8529 | |
| FHXVLR14ULT0a | - - - | - - - | - - - | FHXVLR14ULT0a | 2005_2005 | FHXVLR14ULT0a | 5.0881 | 3.798 | 236.588 | 232.79 | 258.82 | -48.6598 | 26.03 | -22.6298 | 3.0229 | 25.8907 | |
| FHXVLR14ULT0b | - - - | - - - | - - - | FHXVLR14ULT0b | 2005_2005 | FHXVLR14ULT0b | 4.8461 | 3.646 | 237.975 | 234.329 | 258.965 | -47.2558 | 24.636 | -22.6198 | 3.06267 | 25.8529 | |
| FHXVLR14ULT0c | - - - | - - - | - - - | FHXVLR14ULT0c | 2005_2005 | FHXVLR14ULT0c | 5.9638 | 4.677 | 239.019 | 234.342 | 258.782 | -46.2323 | 24.44 | -21.7923 | 3.04409 | 25.7089 | |
| FHXVLR14ULT0d | - - - | - - - | - - - | FHXVLR14ULT0d | 2005_2005 | FHXVLR14ULT0d | -7.2534 | -8.851 | 225.166 | 234.017 | 260.019 | -59.8812 | 26.002 | -33.8792 | 3.15521 | 25.0452 | |
| FHXVLR14ULT0afallv08 | - - - | - - - | - - - | FHXVLR14ULT0afallv08 | 2005_2005 | FHXVLR14ULT0afallv08 | 4.6284 | 3.426 | 238.073 | 234.647 | 258.917 | -47.1731 | 24.27 | -22.9031 | 3.05909 | 25.6827 | |
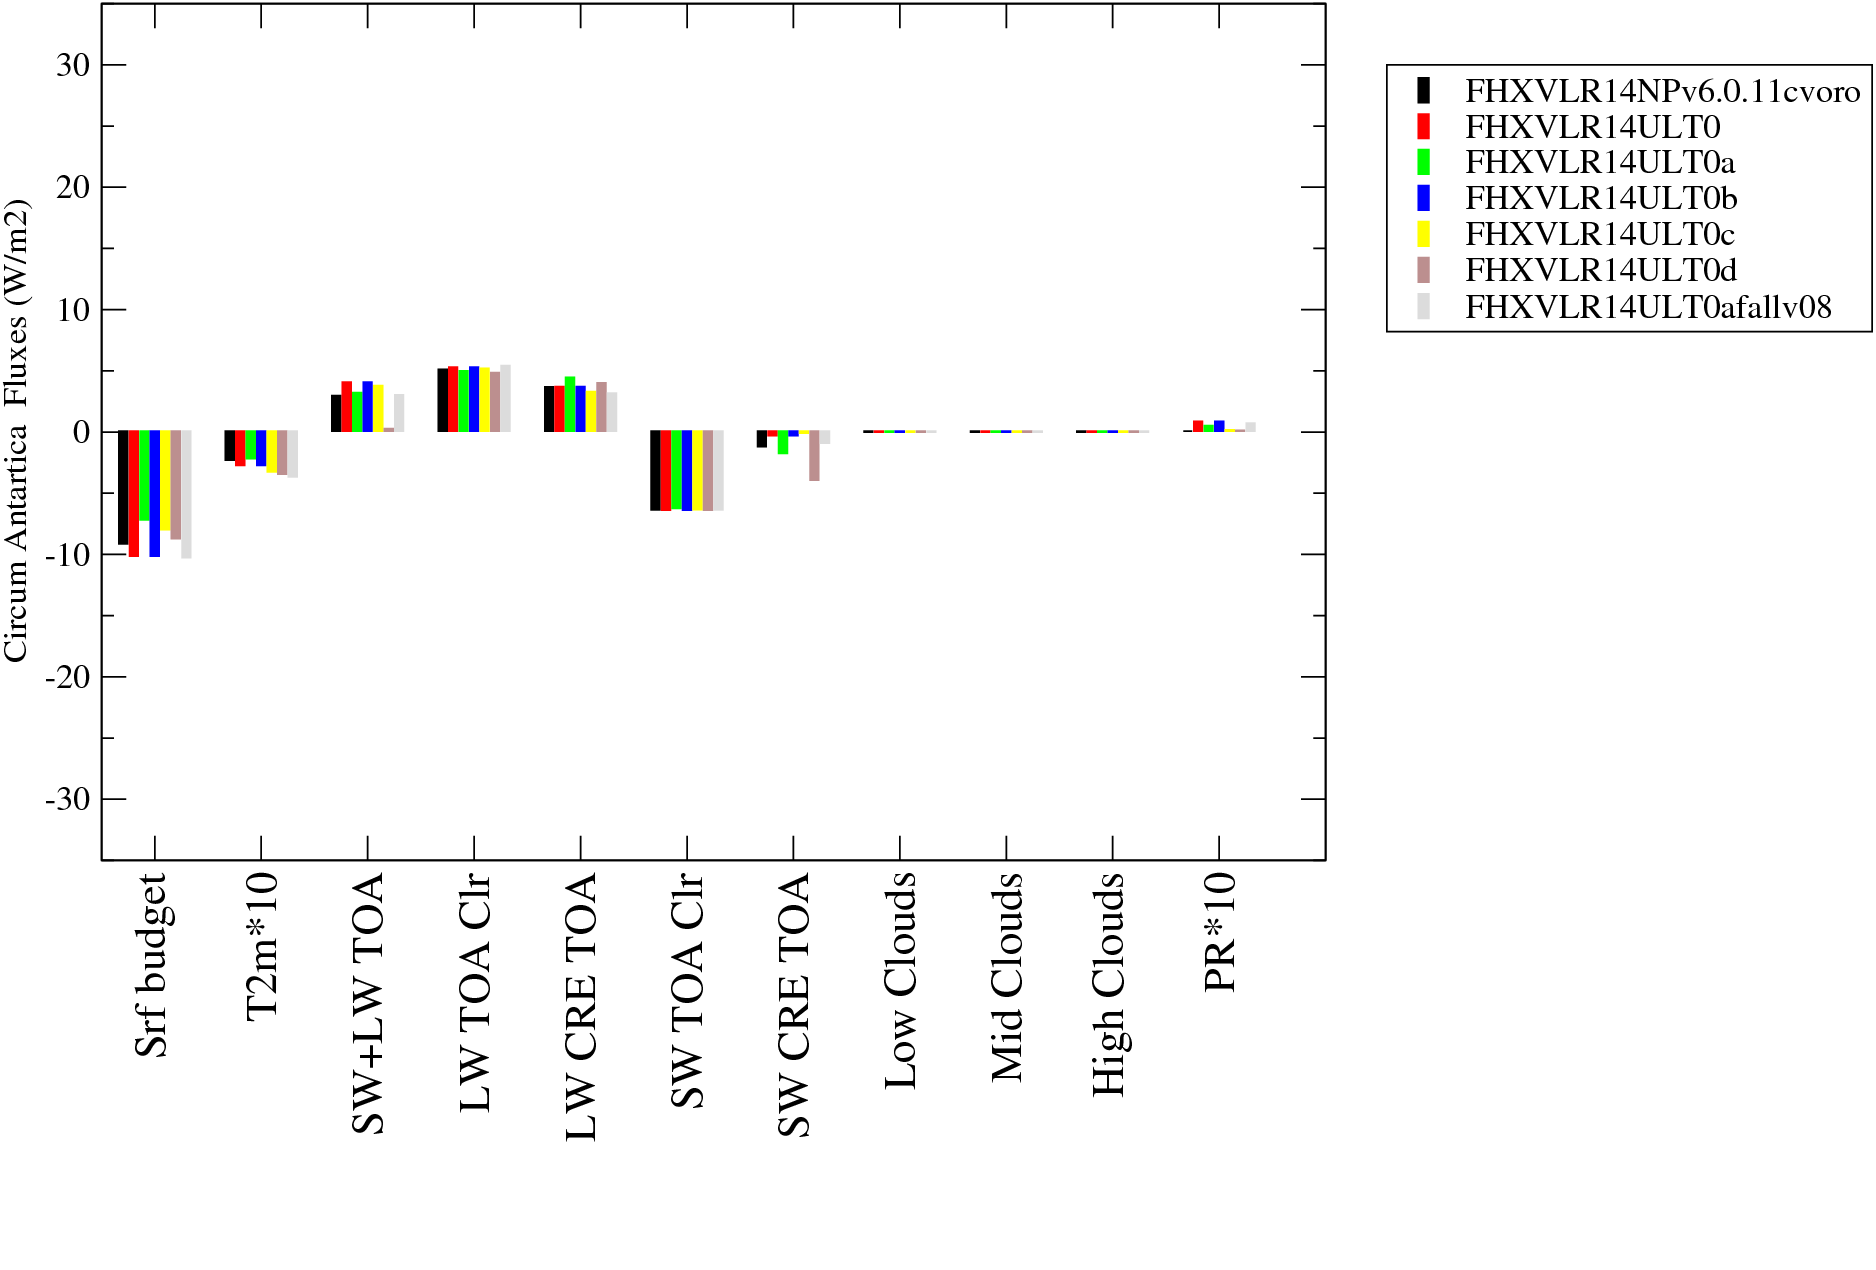
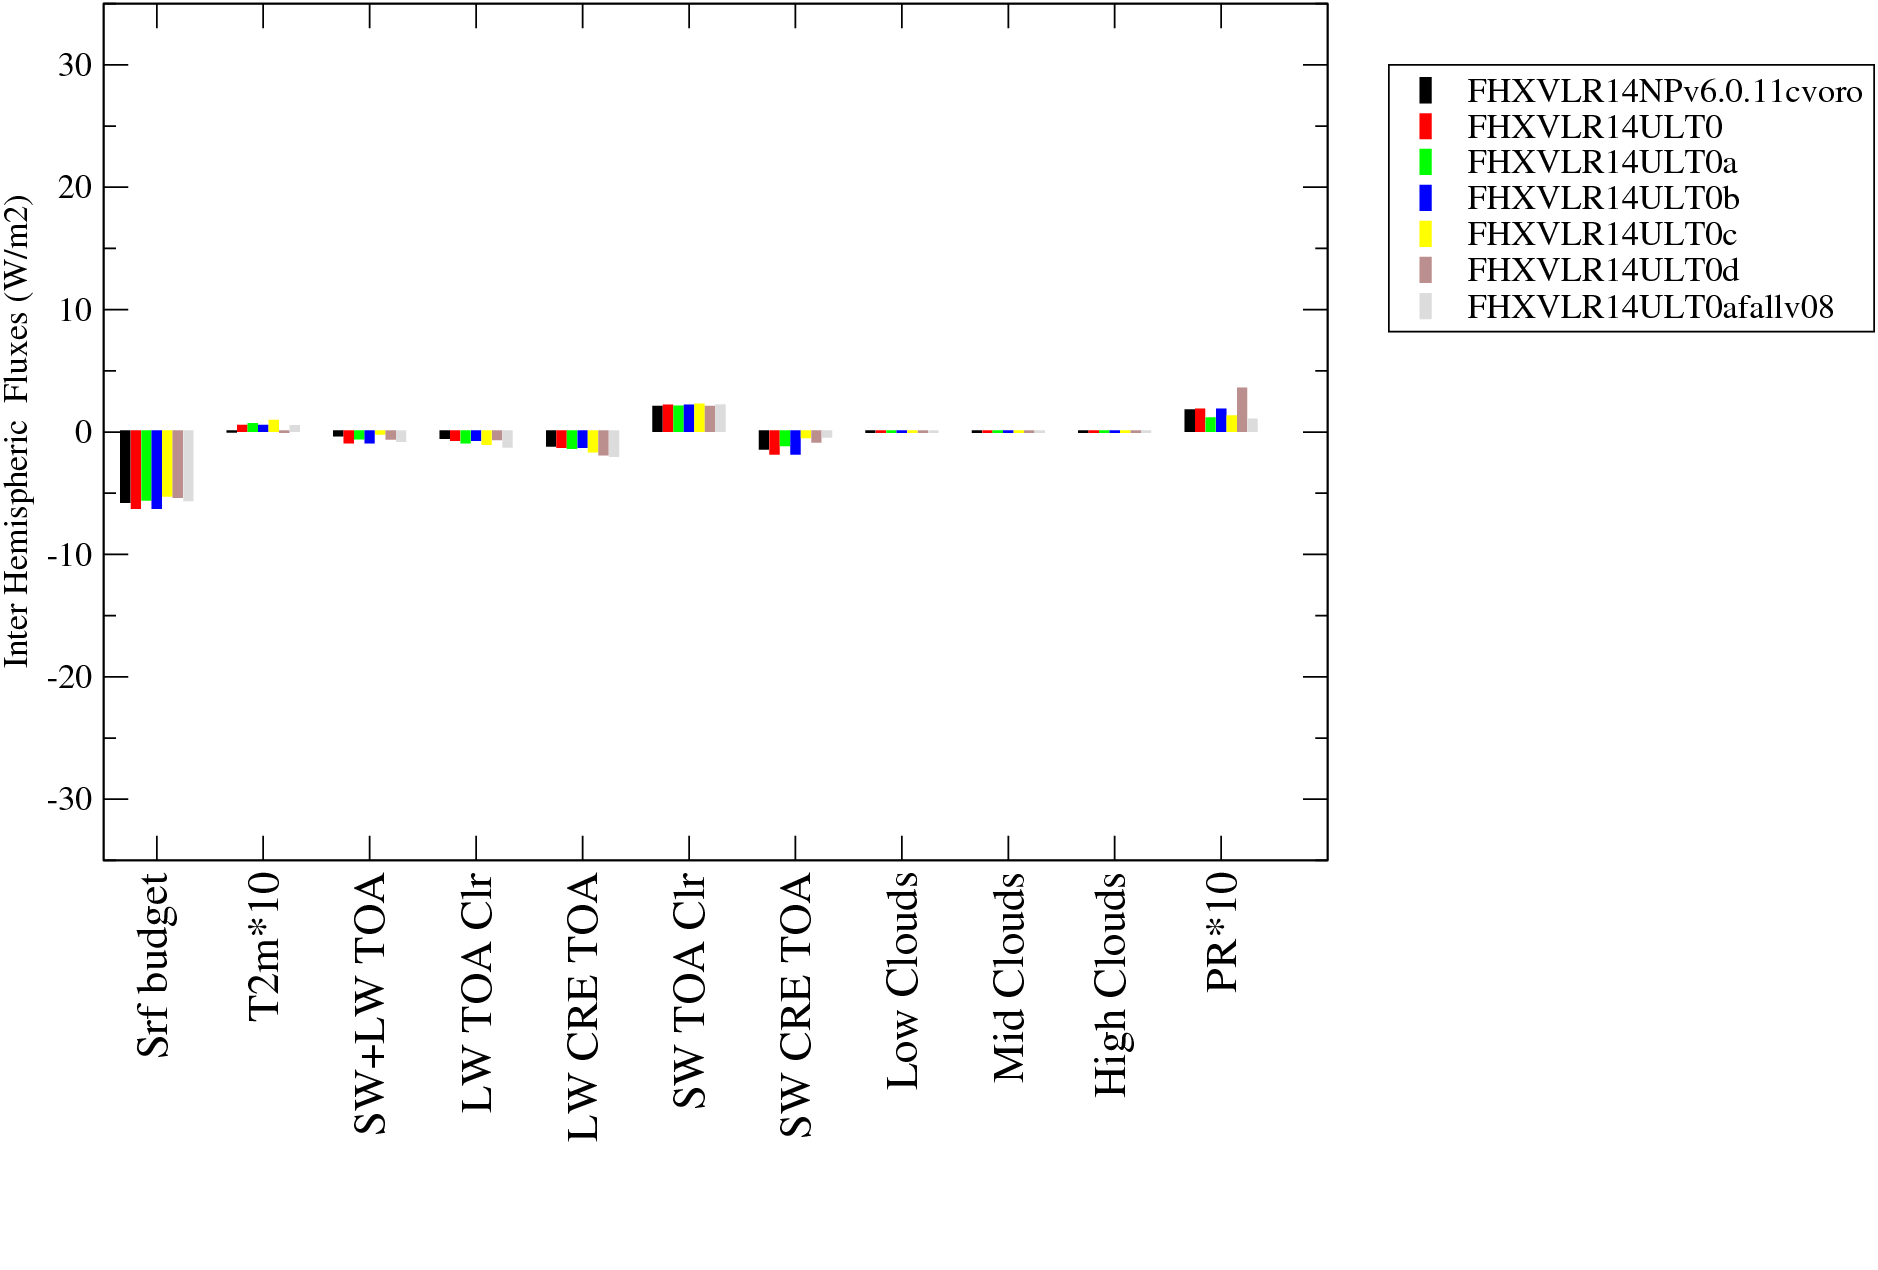
| Global | Circum. Antart | Circum. Antart anom | Inter Hemispheric |
|
|
|
|
|
|
|
|
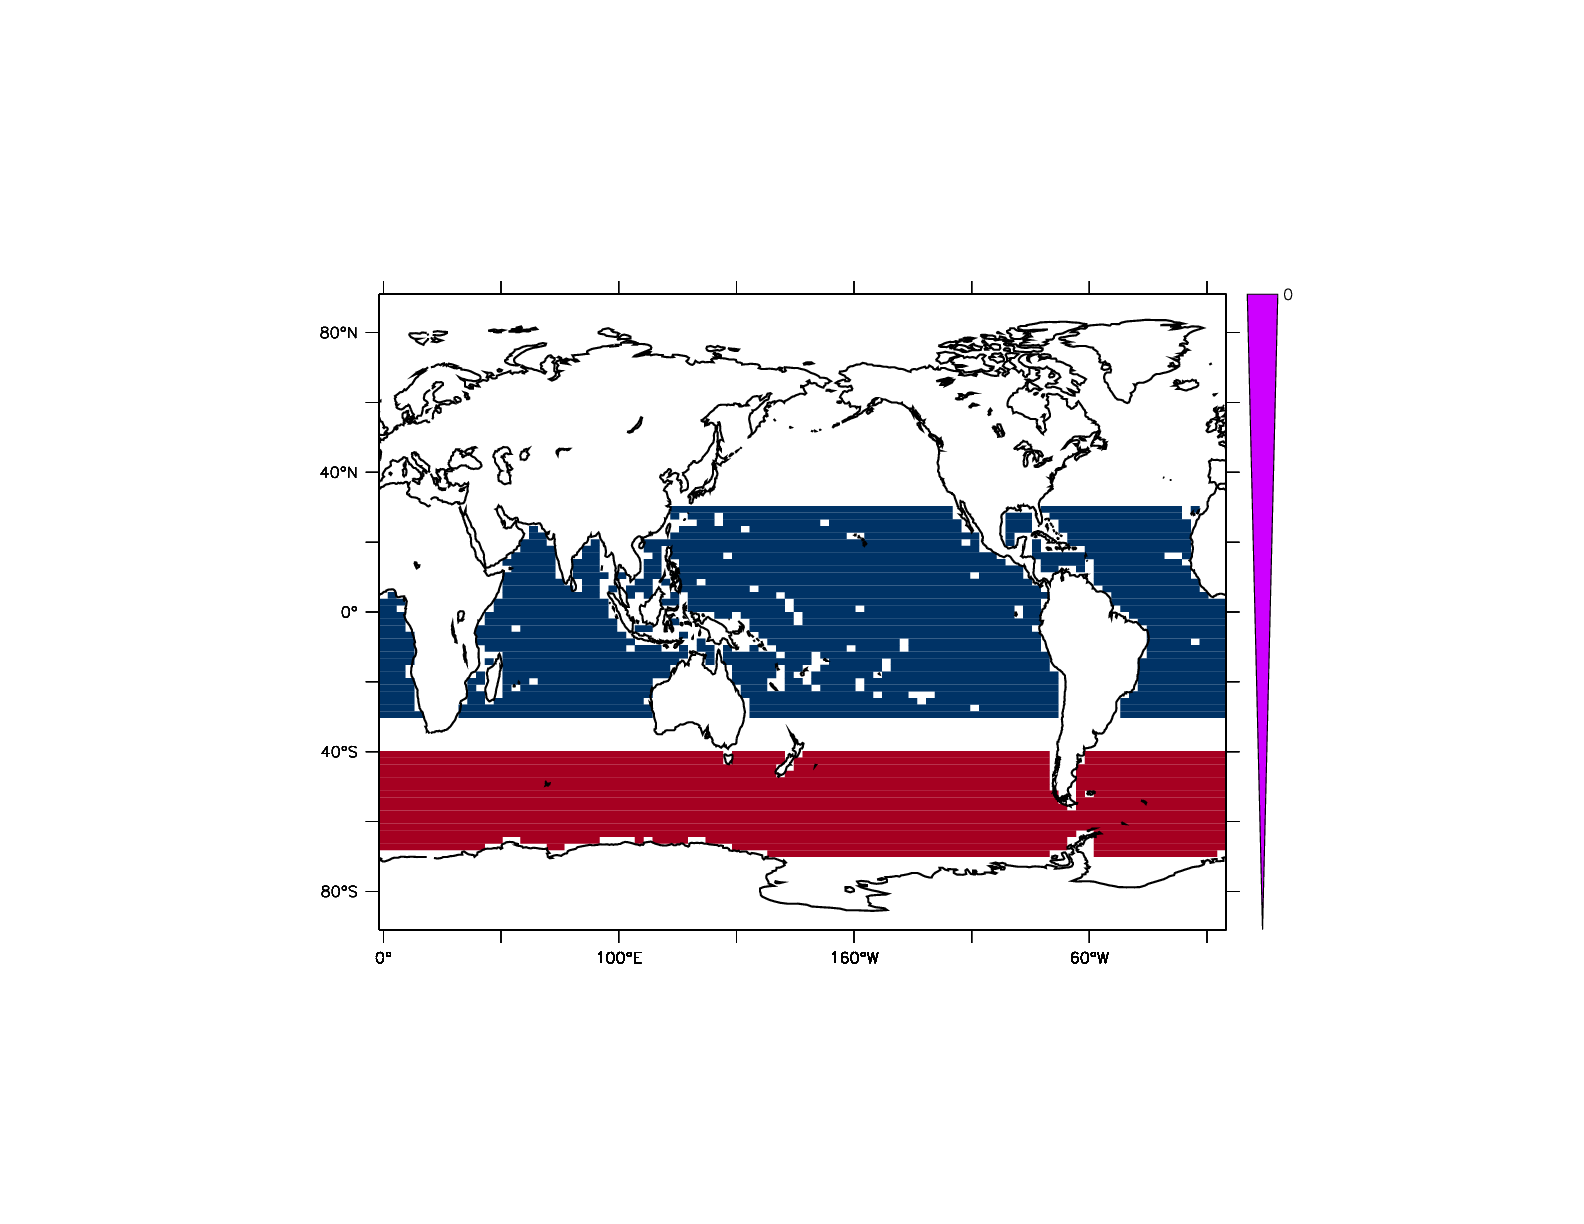
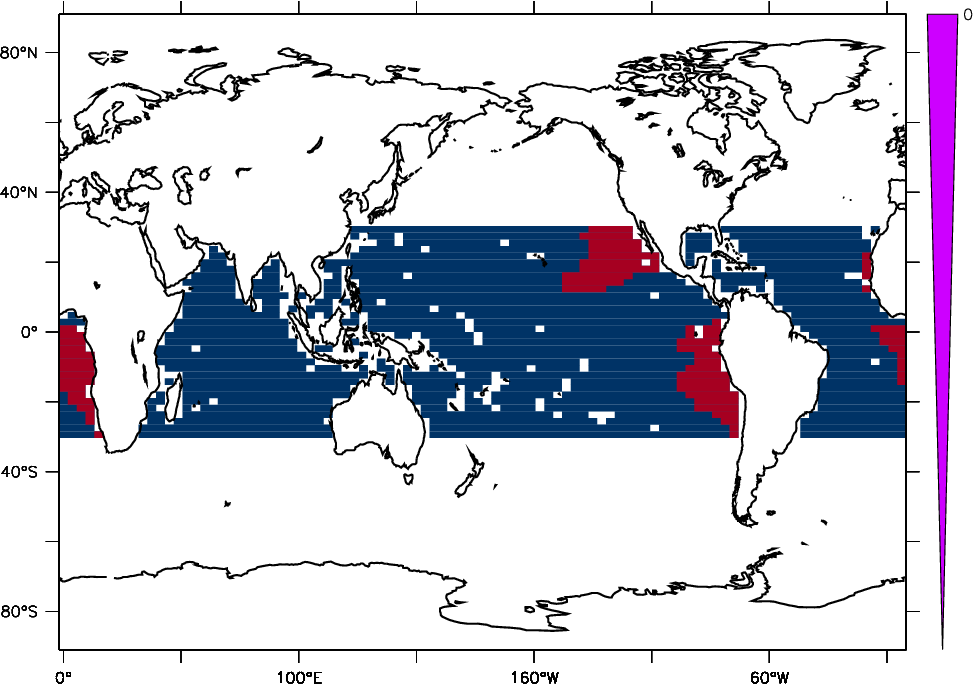
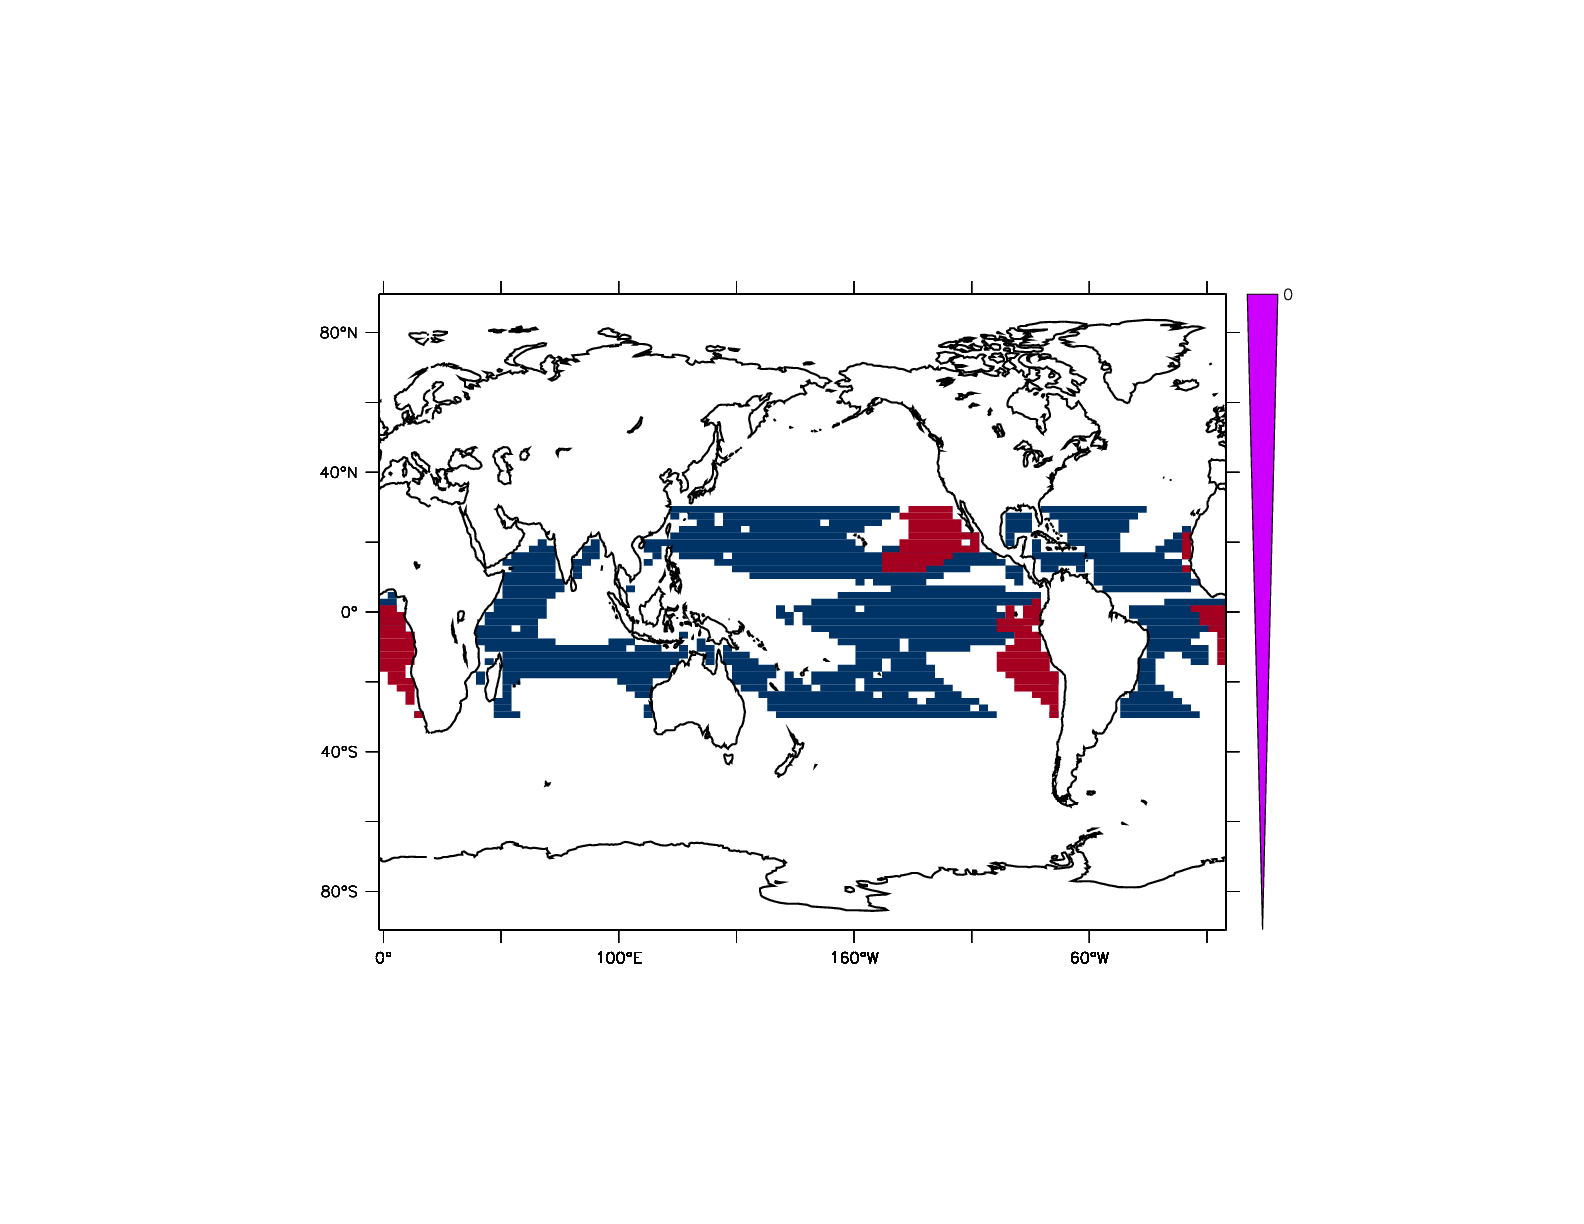
| East Tropic Ocean Anom. (ETOA) | ETO anom : ETO - WEAK | ETO anom : SUBS - WEAK | |
|
|
|
|
|
|
|
|
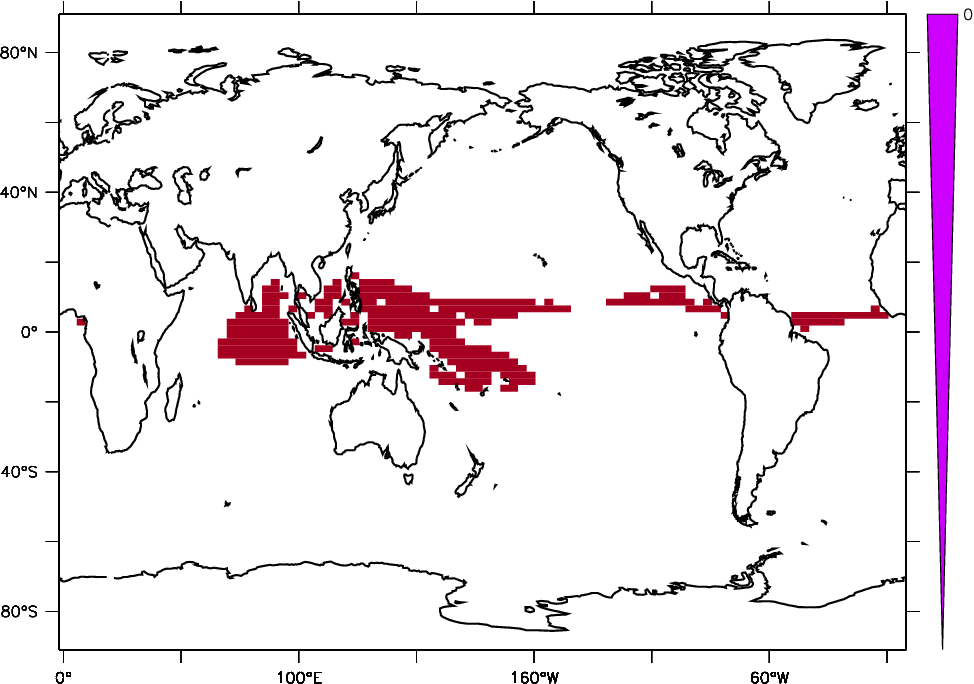
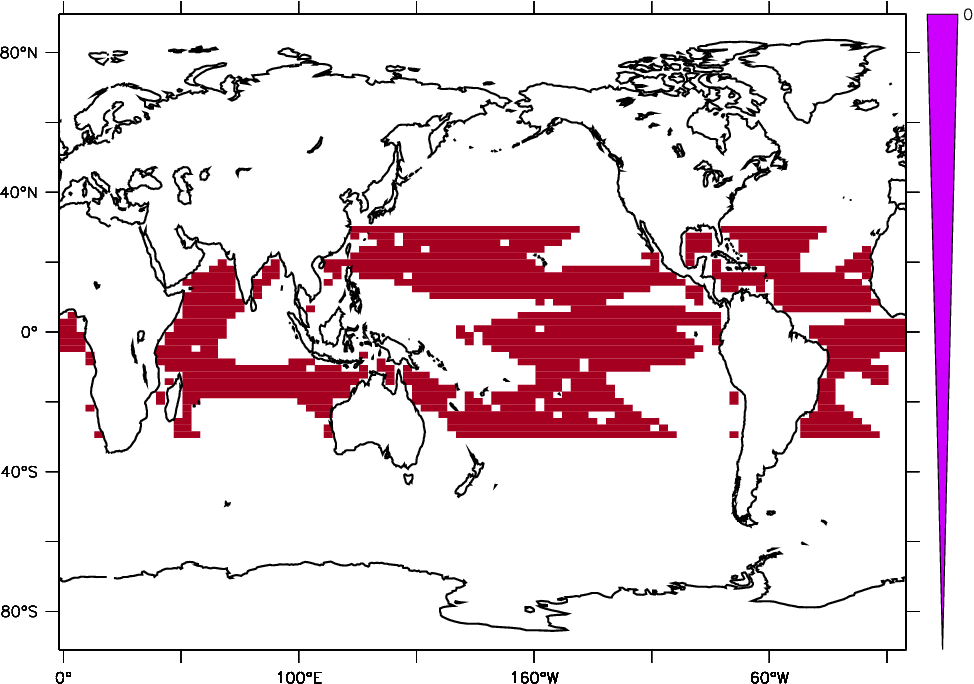
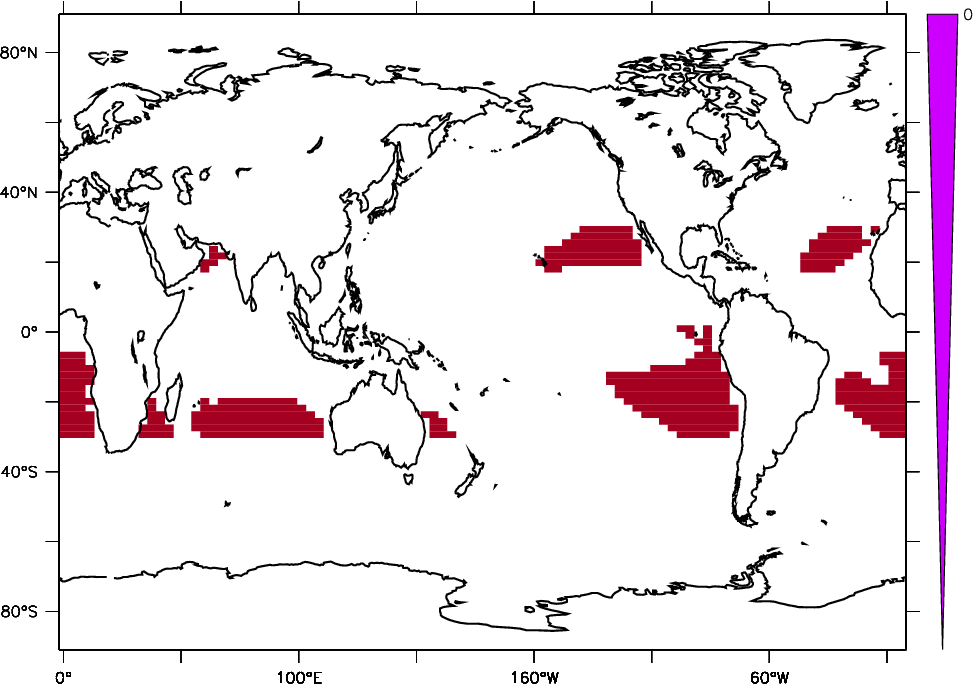
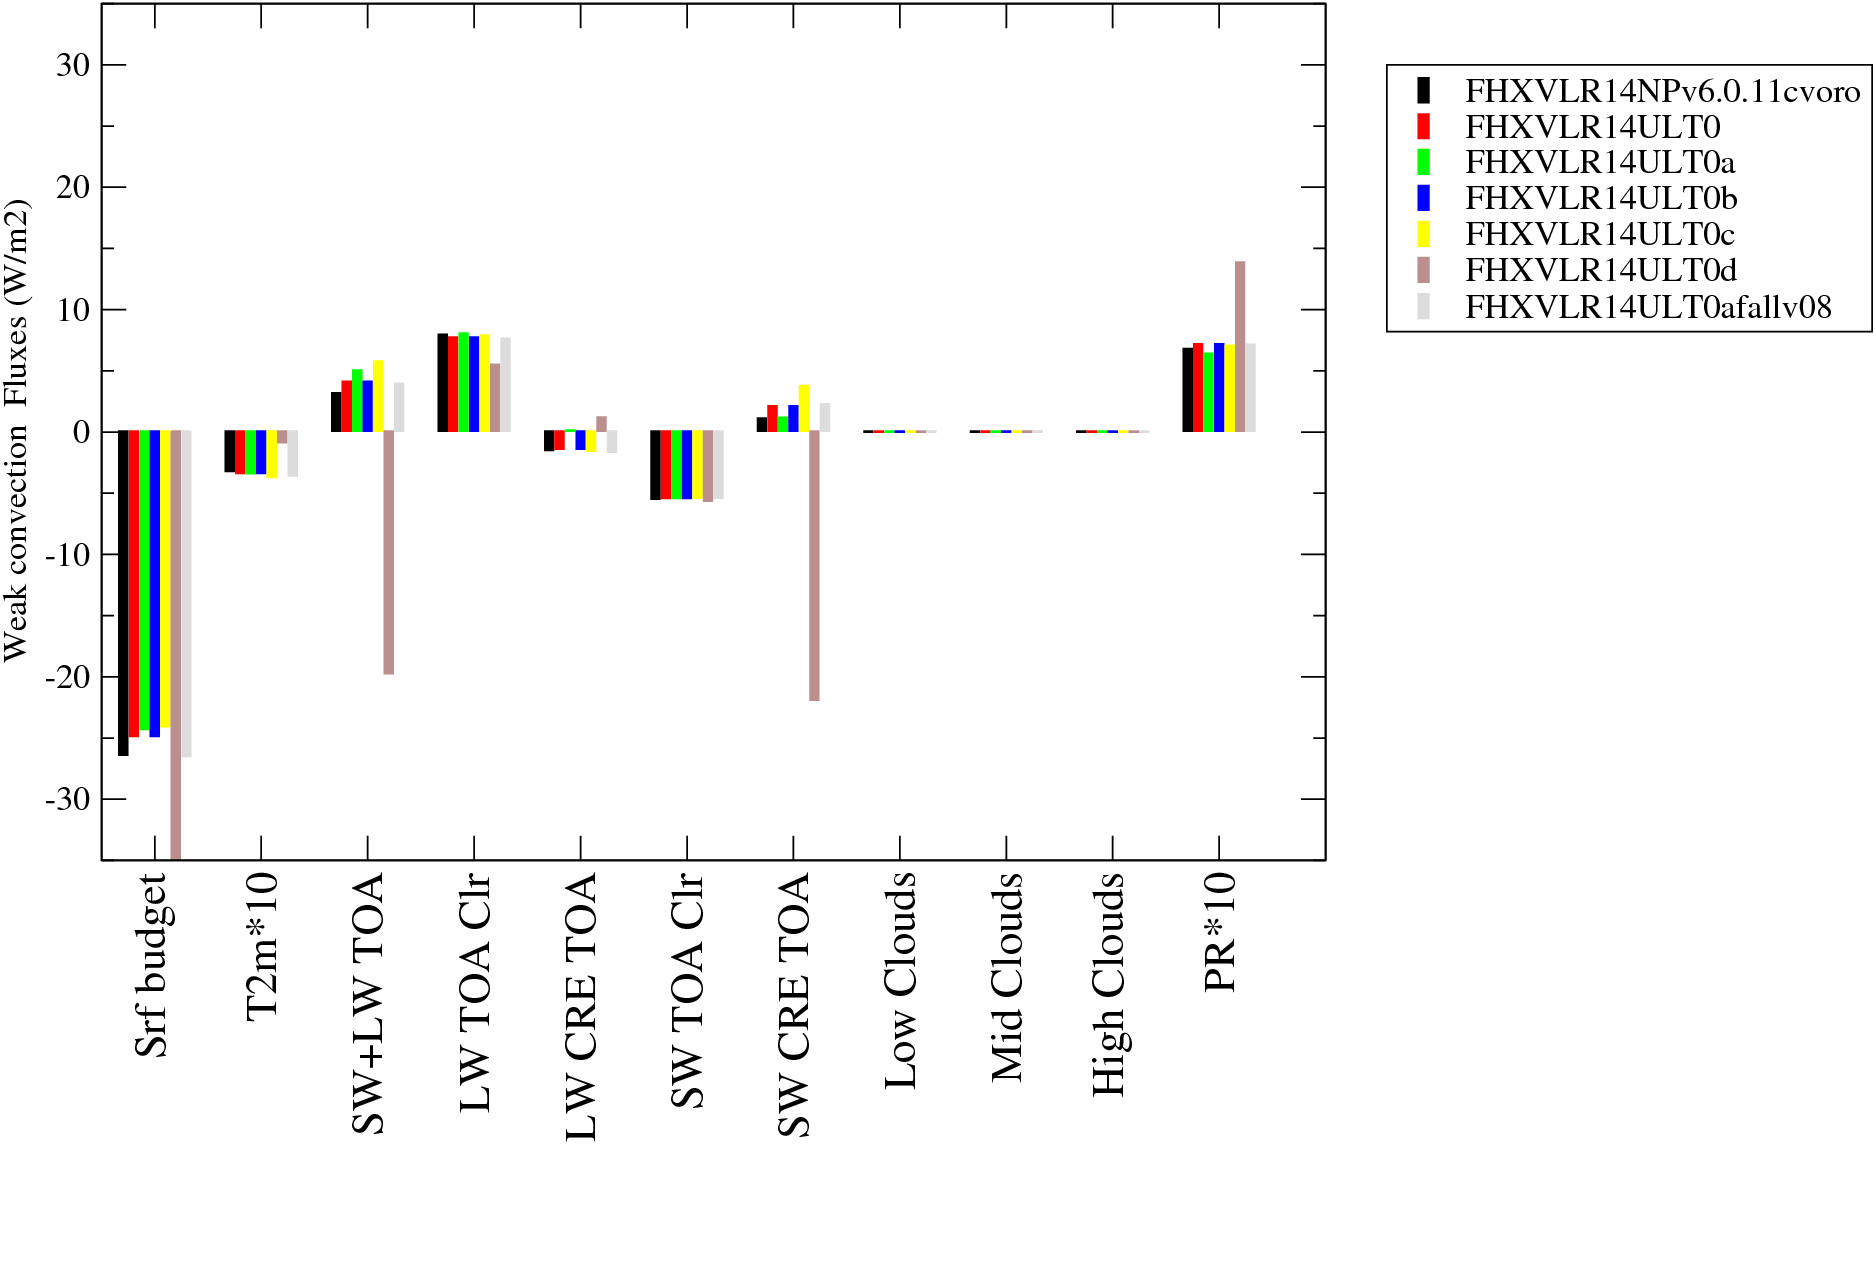
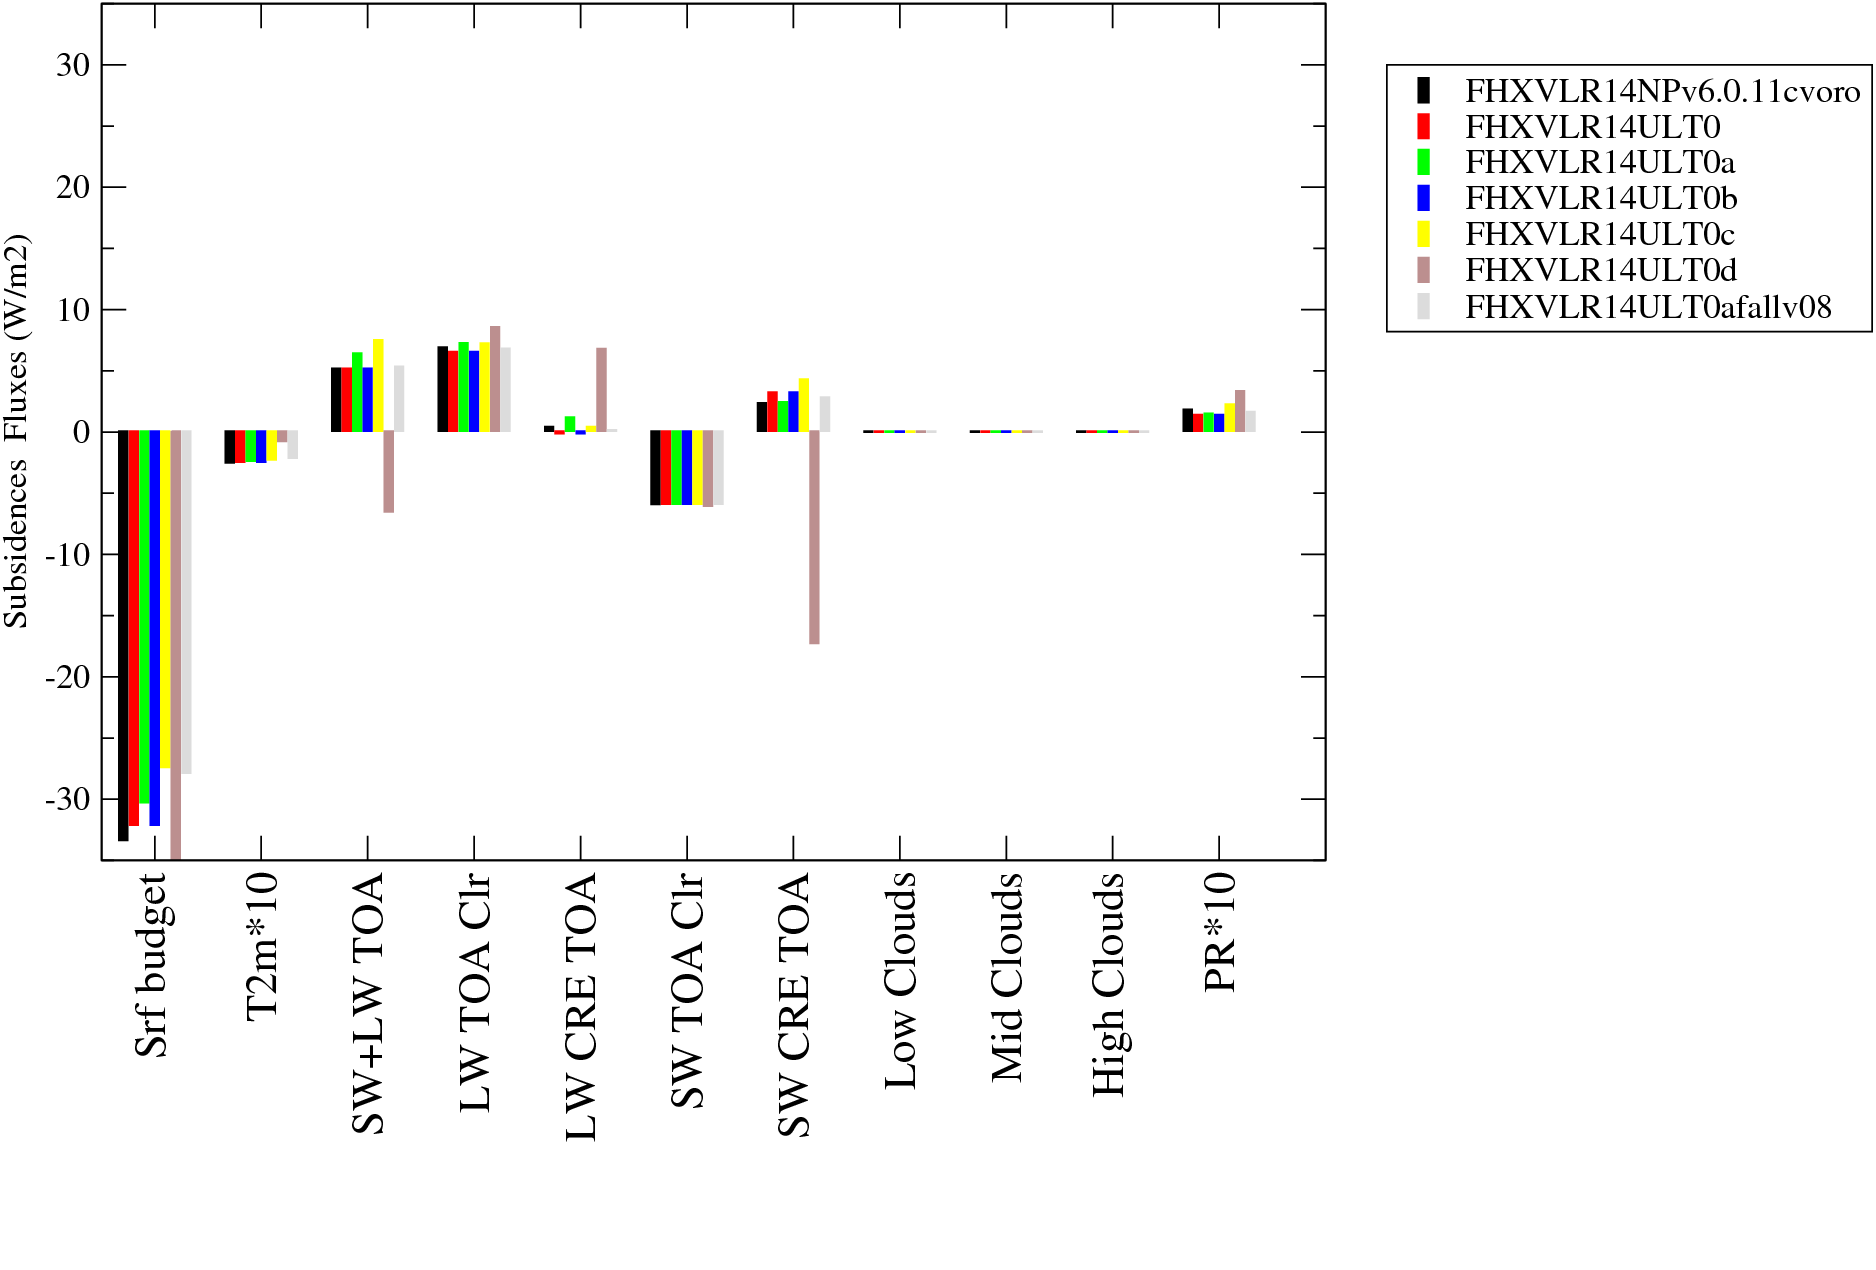
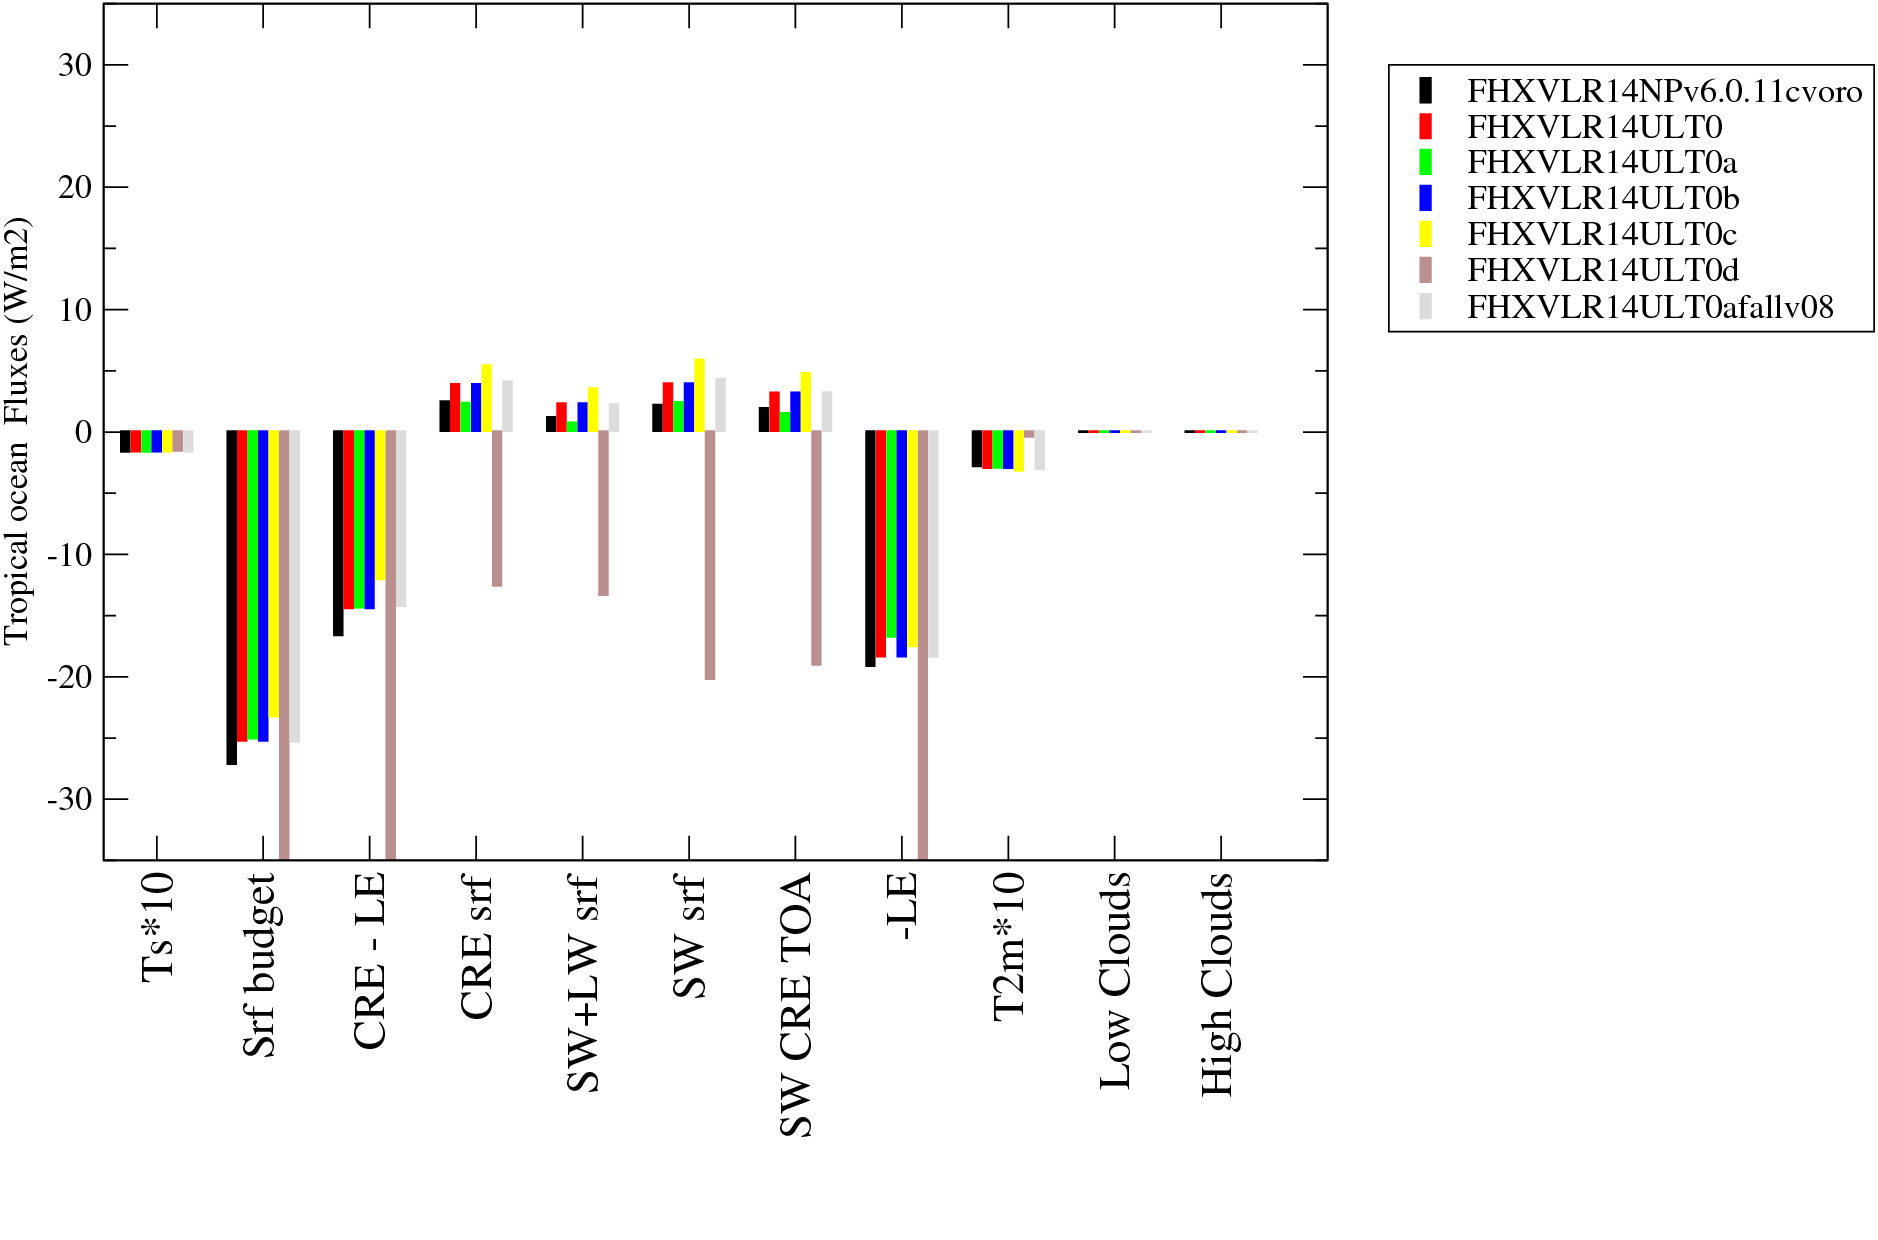
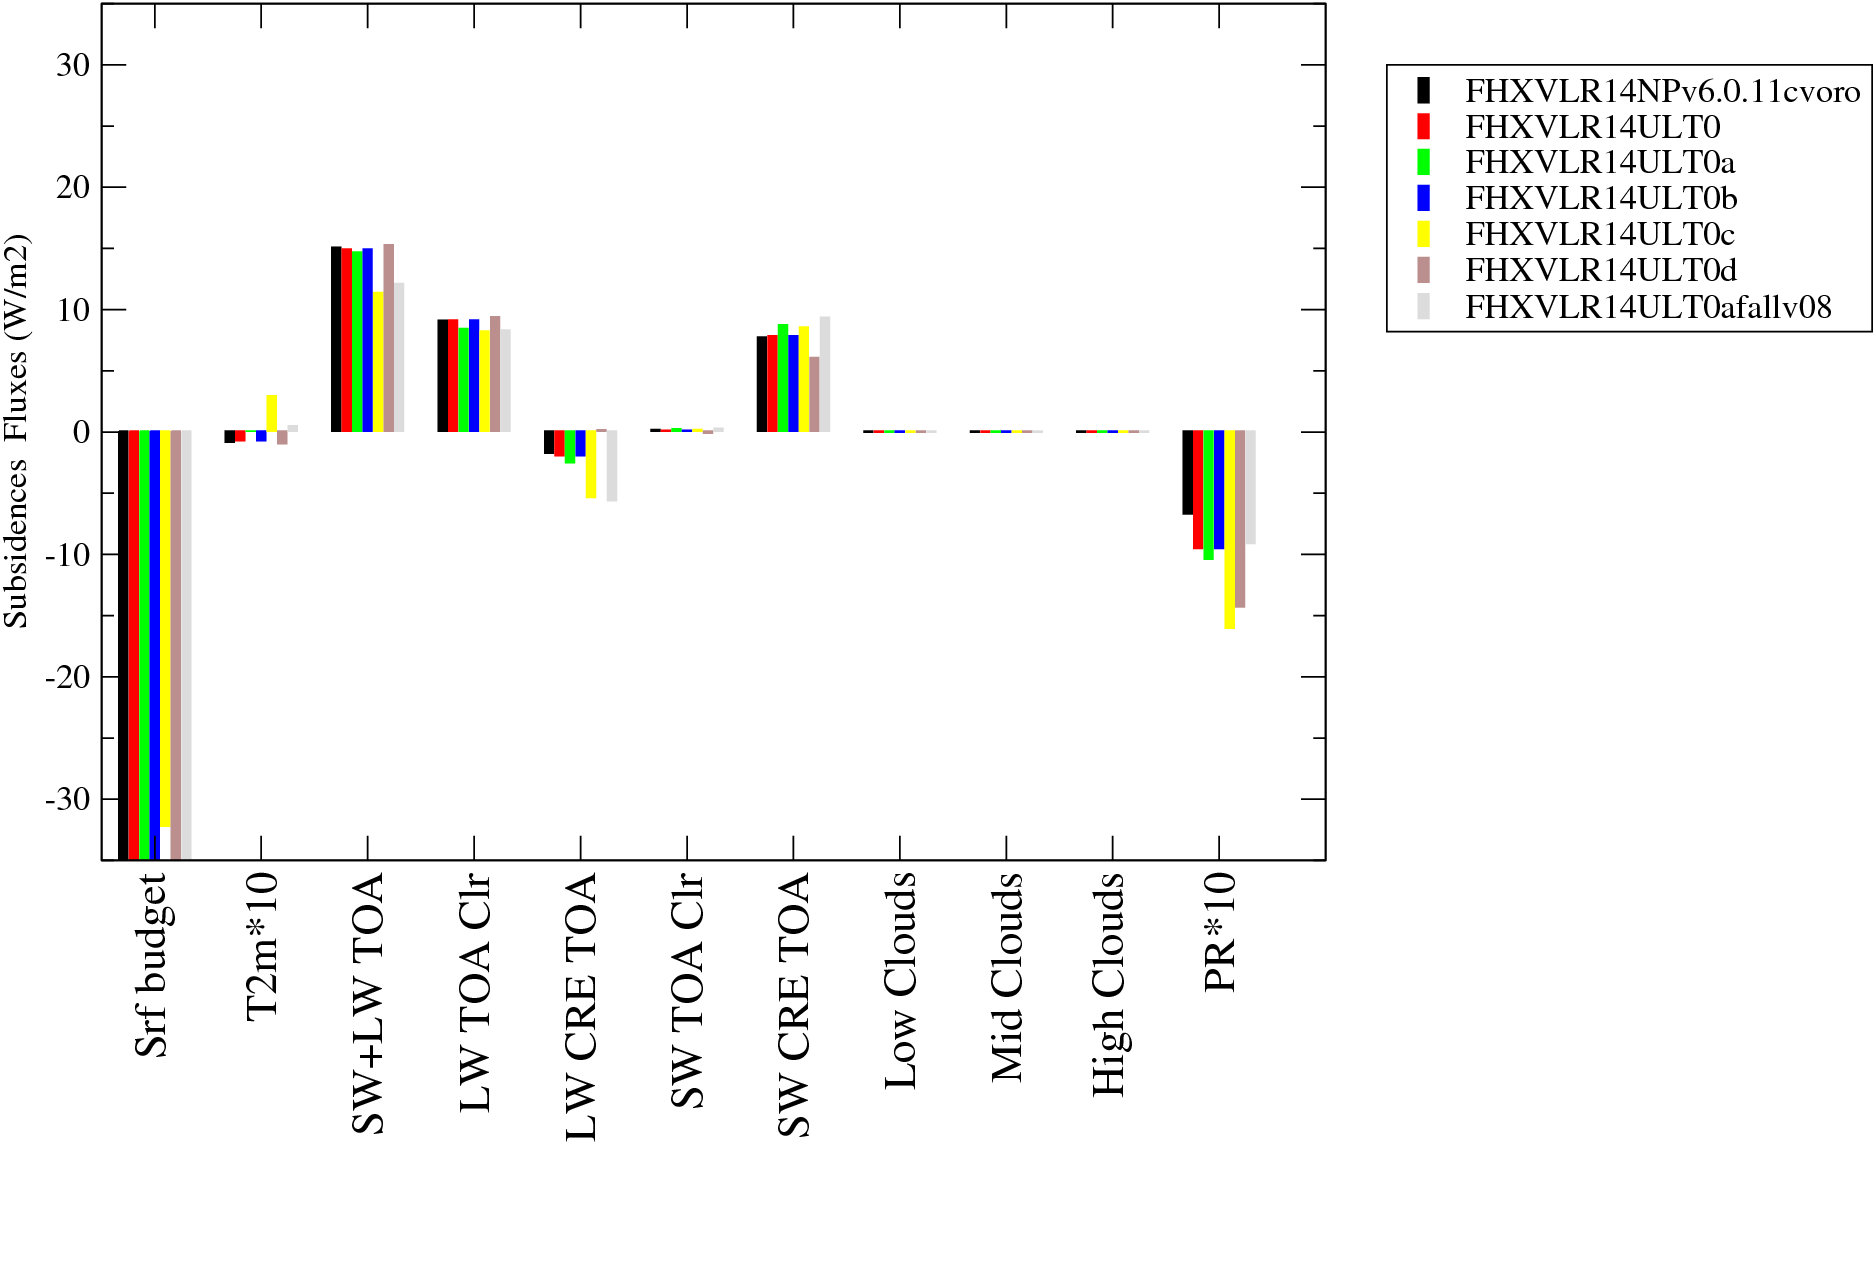
| Convective | Weak | Subsidence | Tropic oceans |
|
|
|
|
|
|
|
|
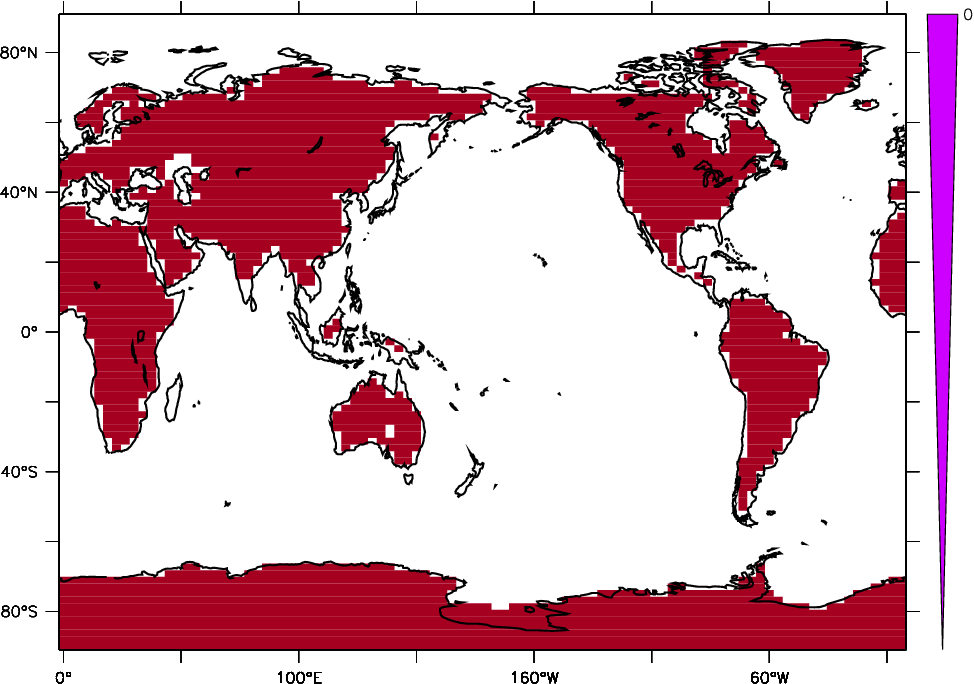
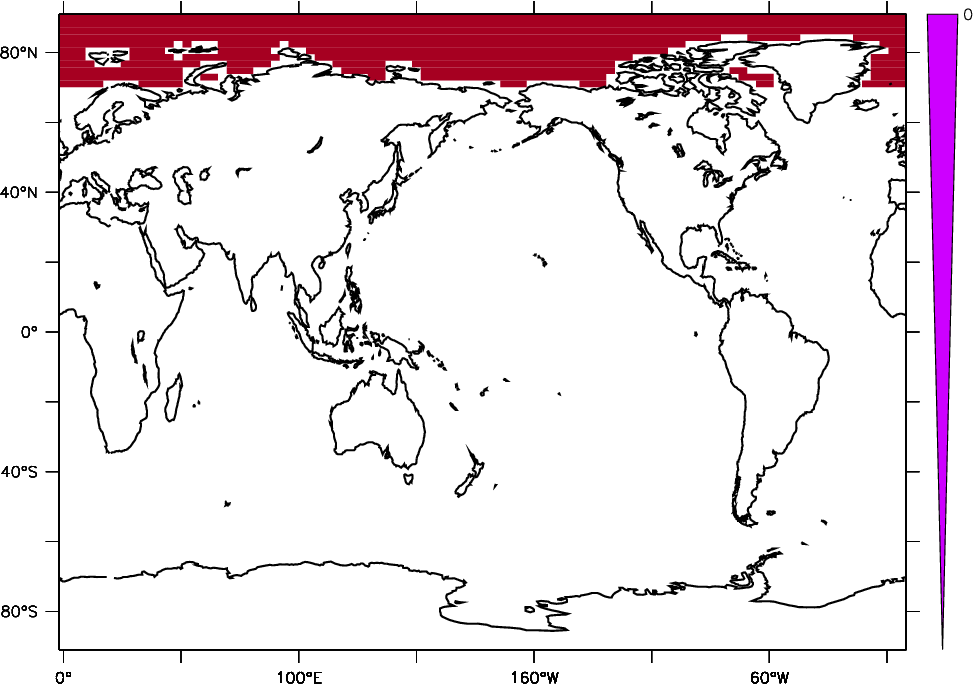
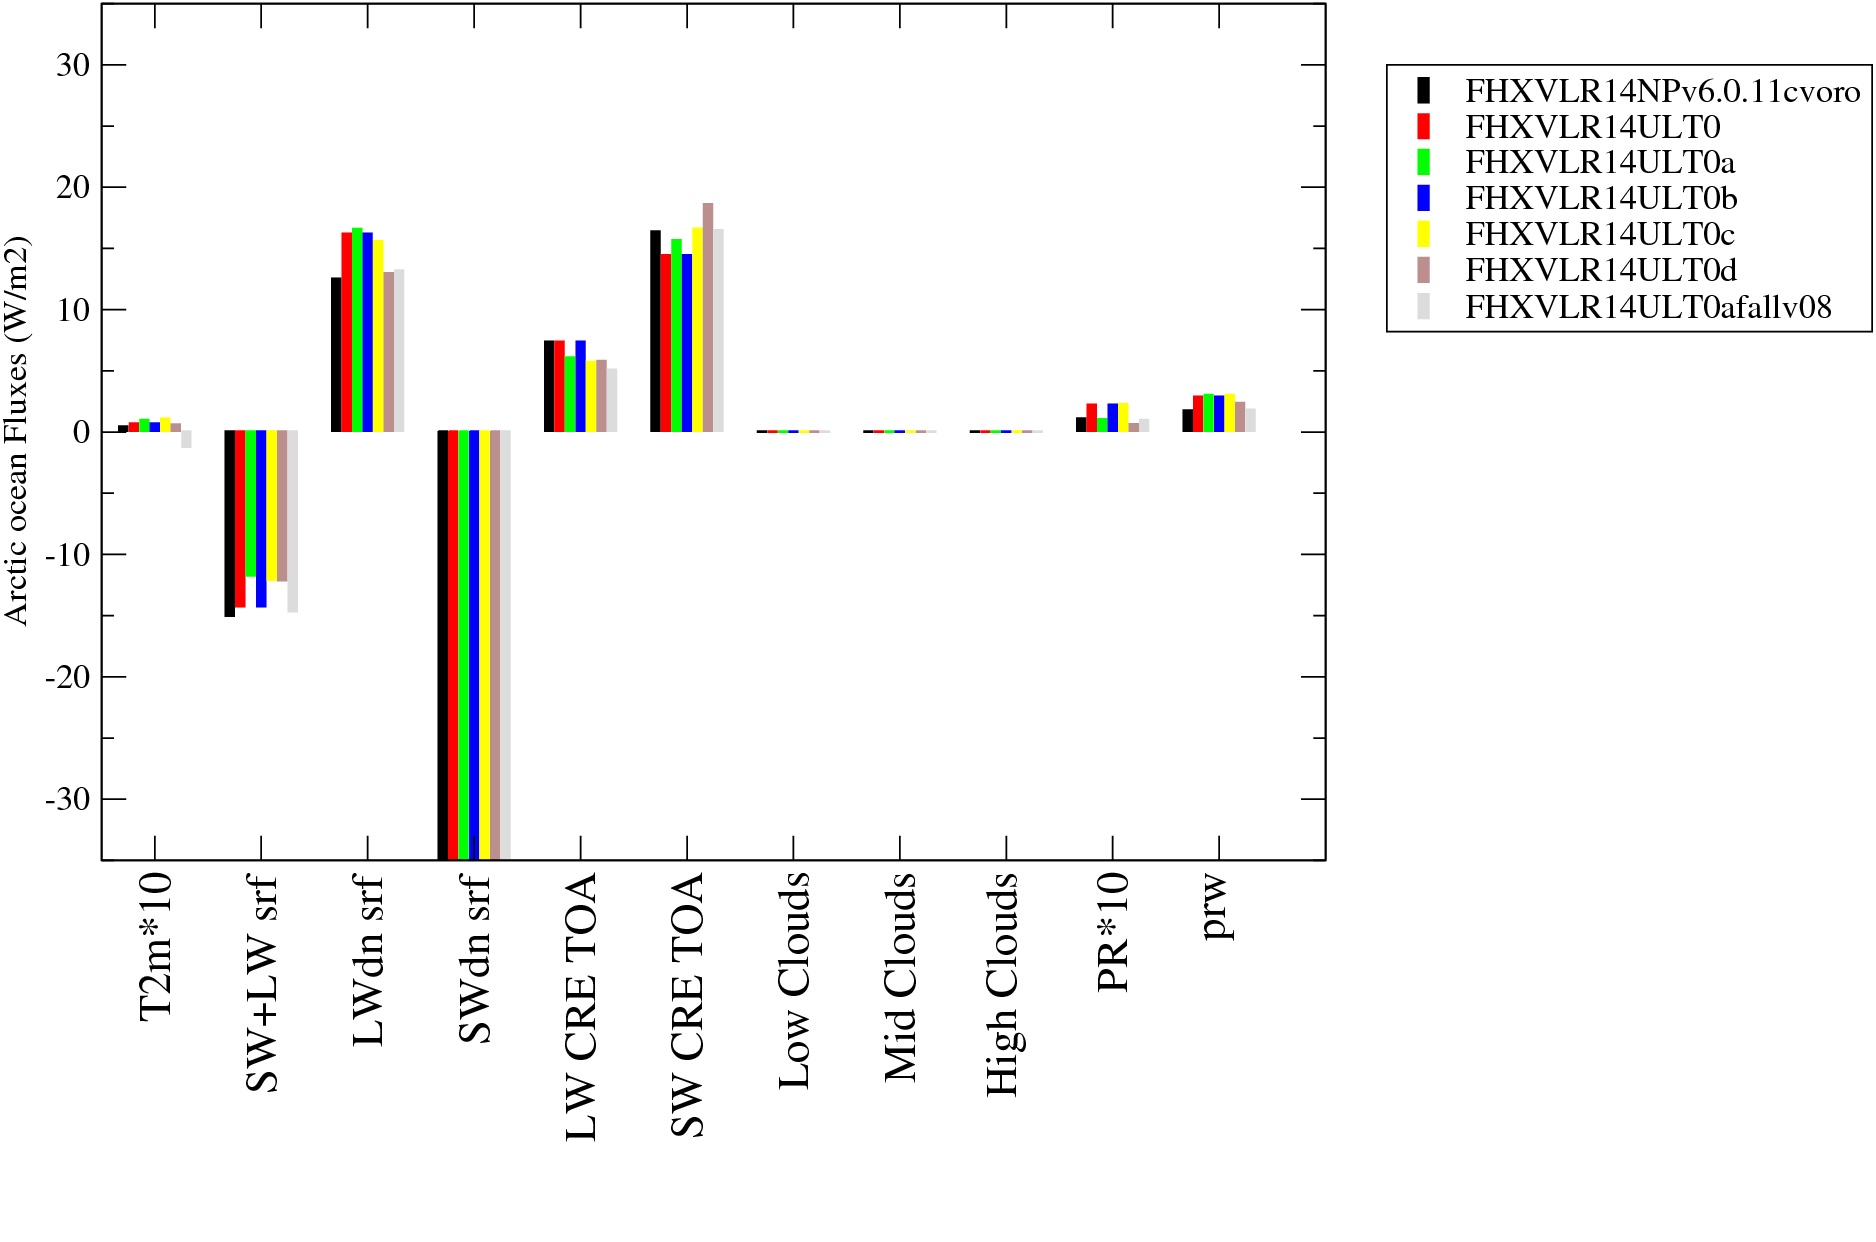
| Oceans | Continent | N. Atlantic | Arctic Oce. |
|
|
|
|
|
|
|
|
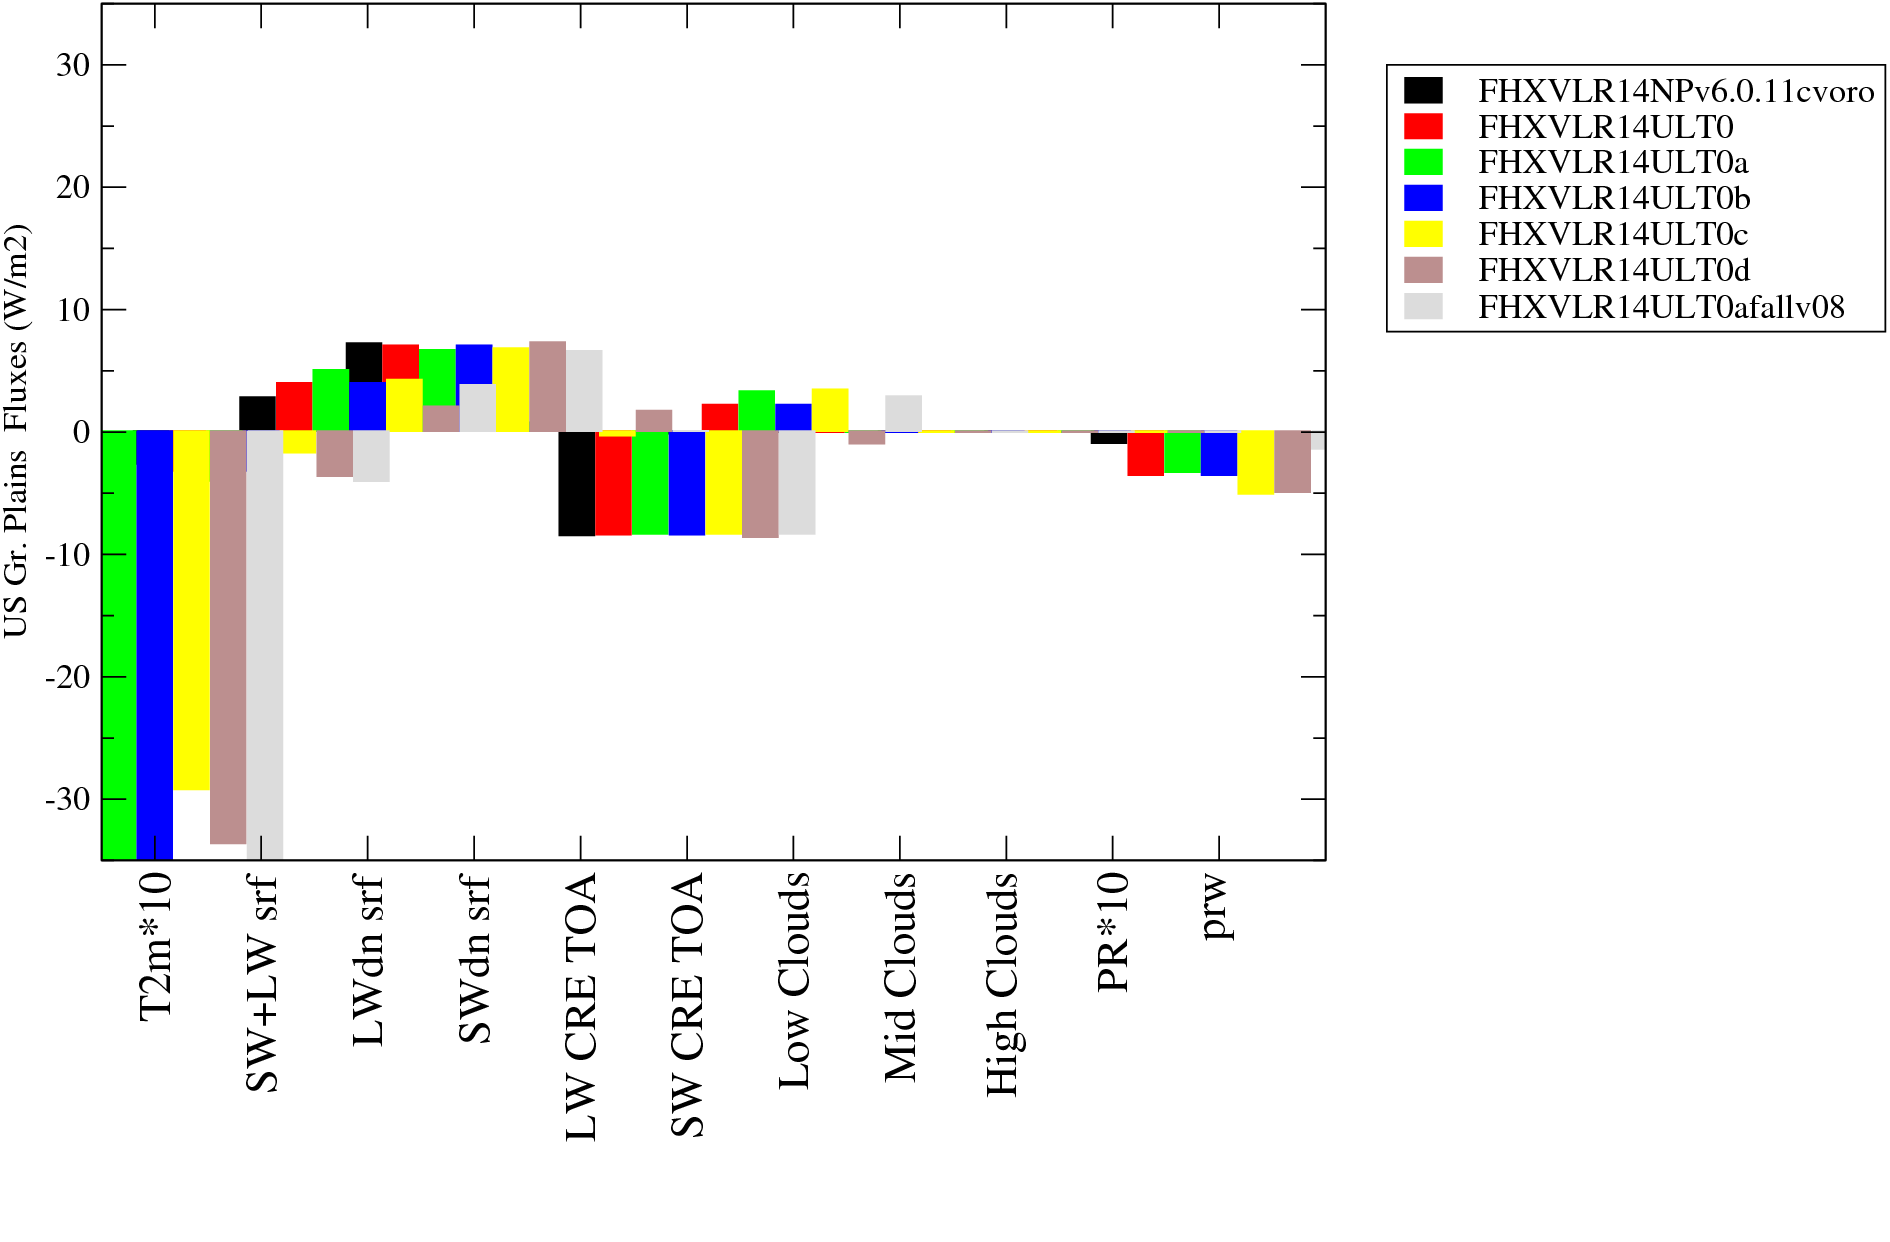
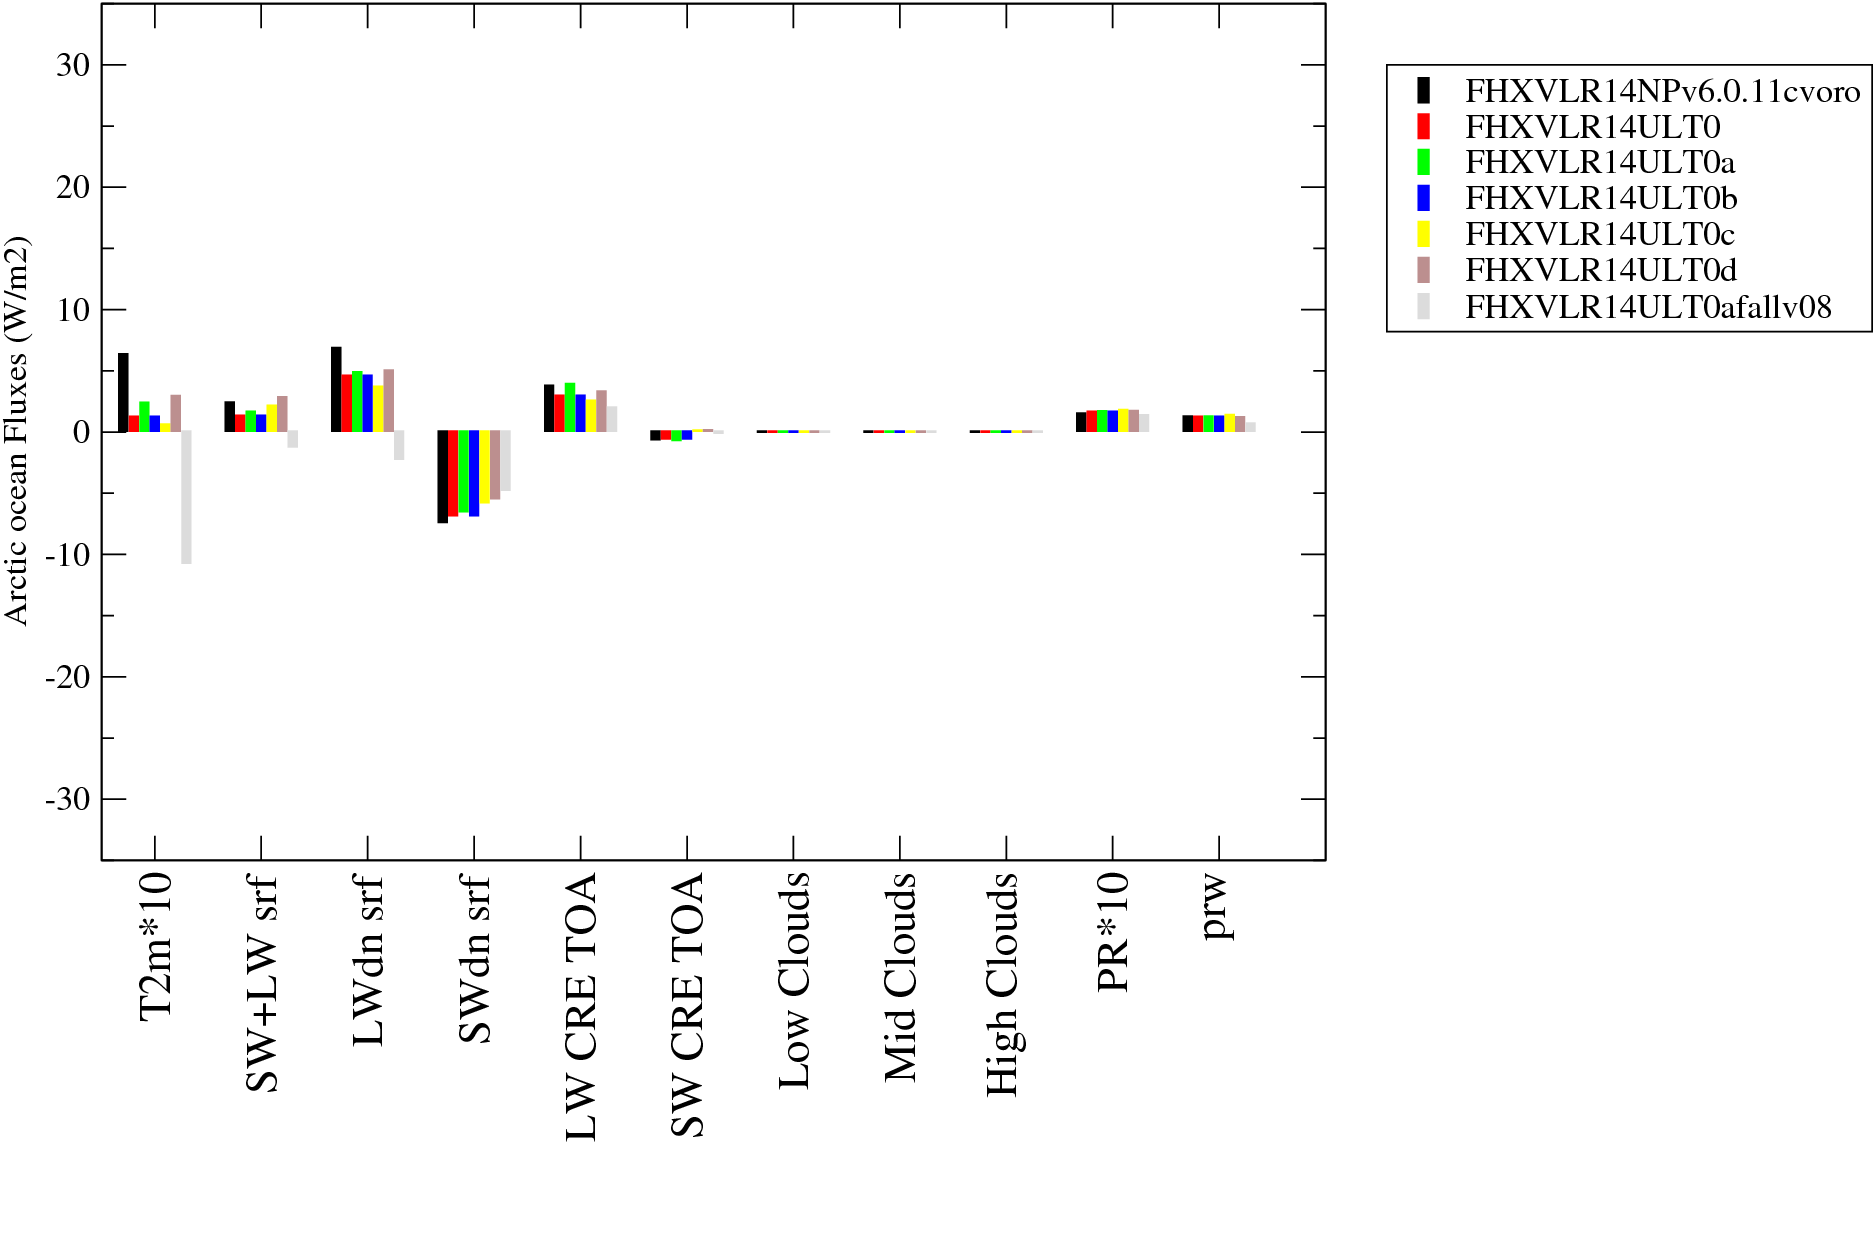
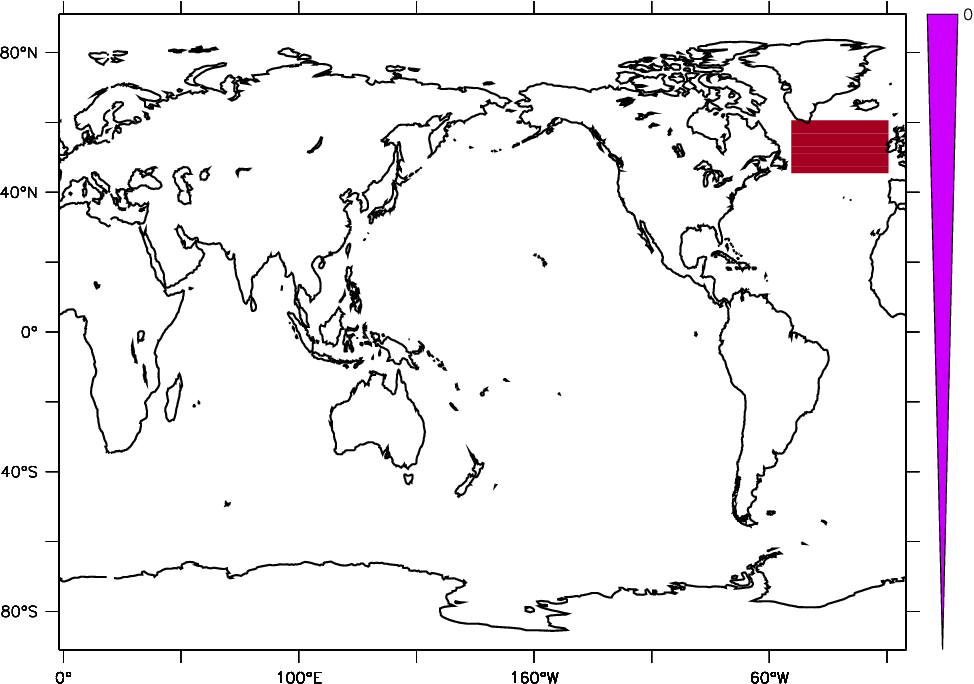
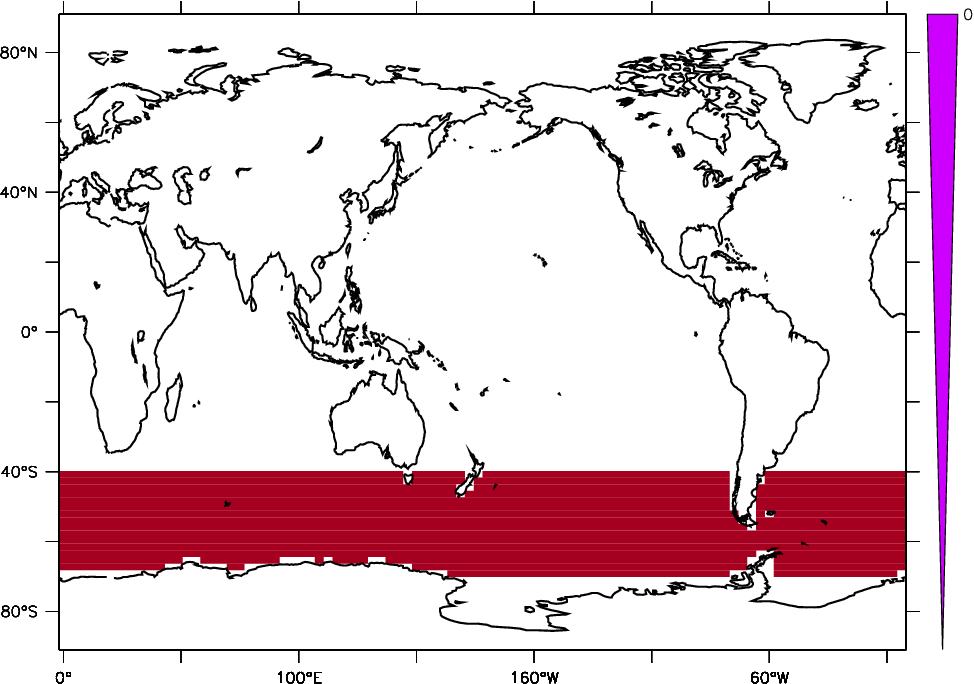
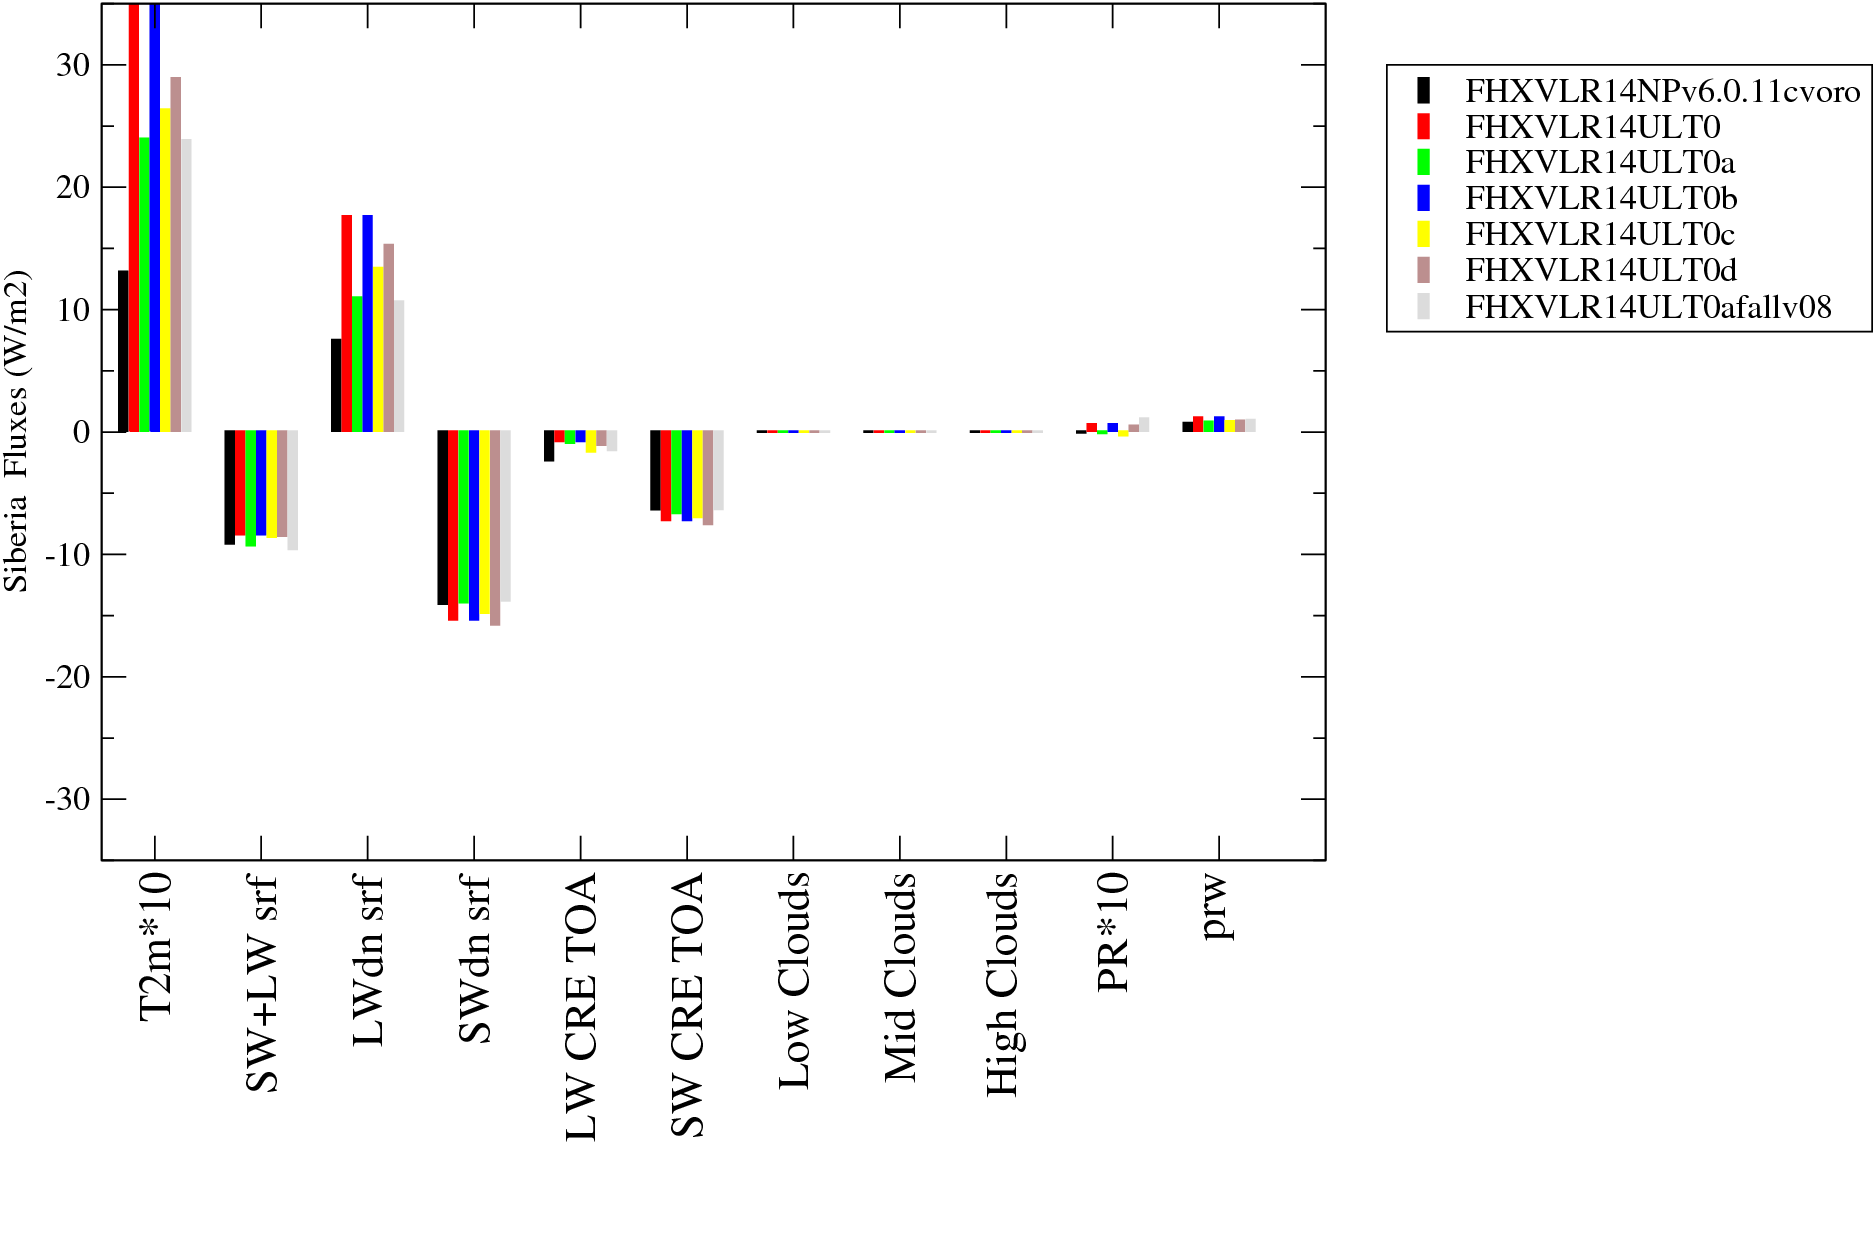
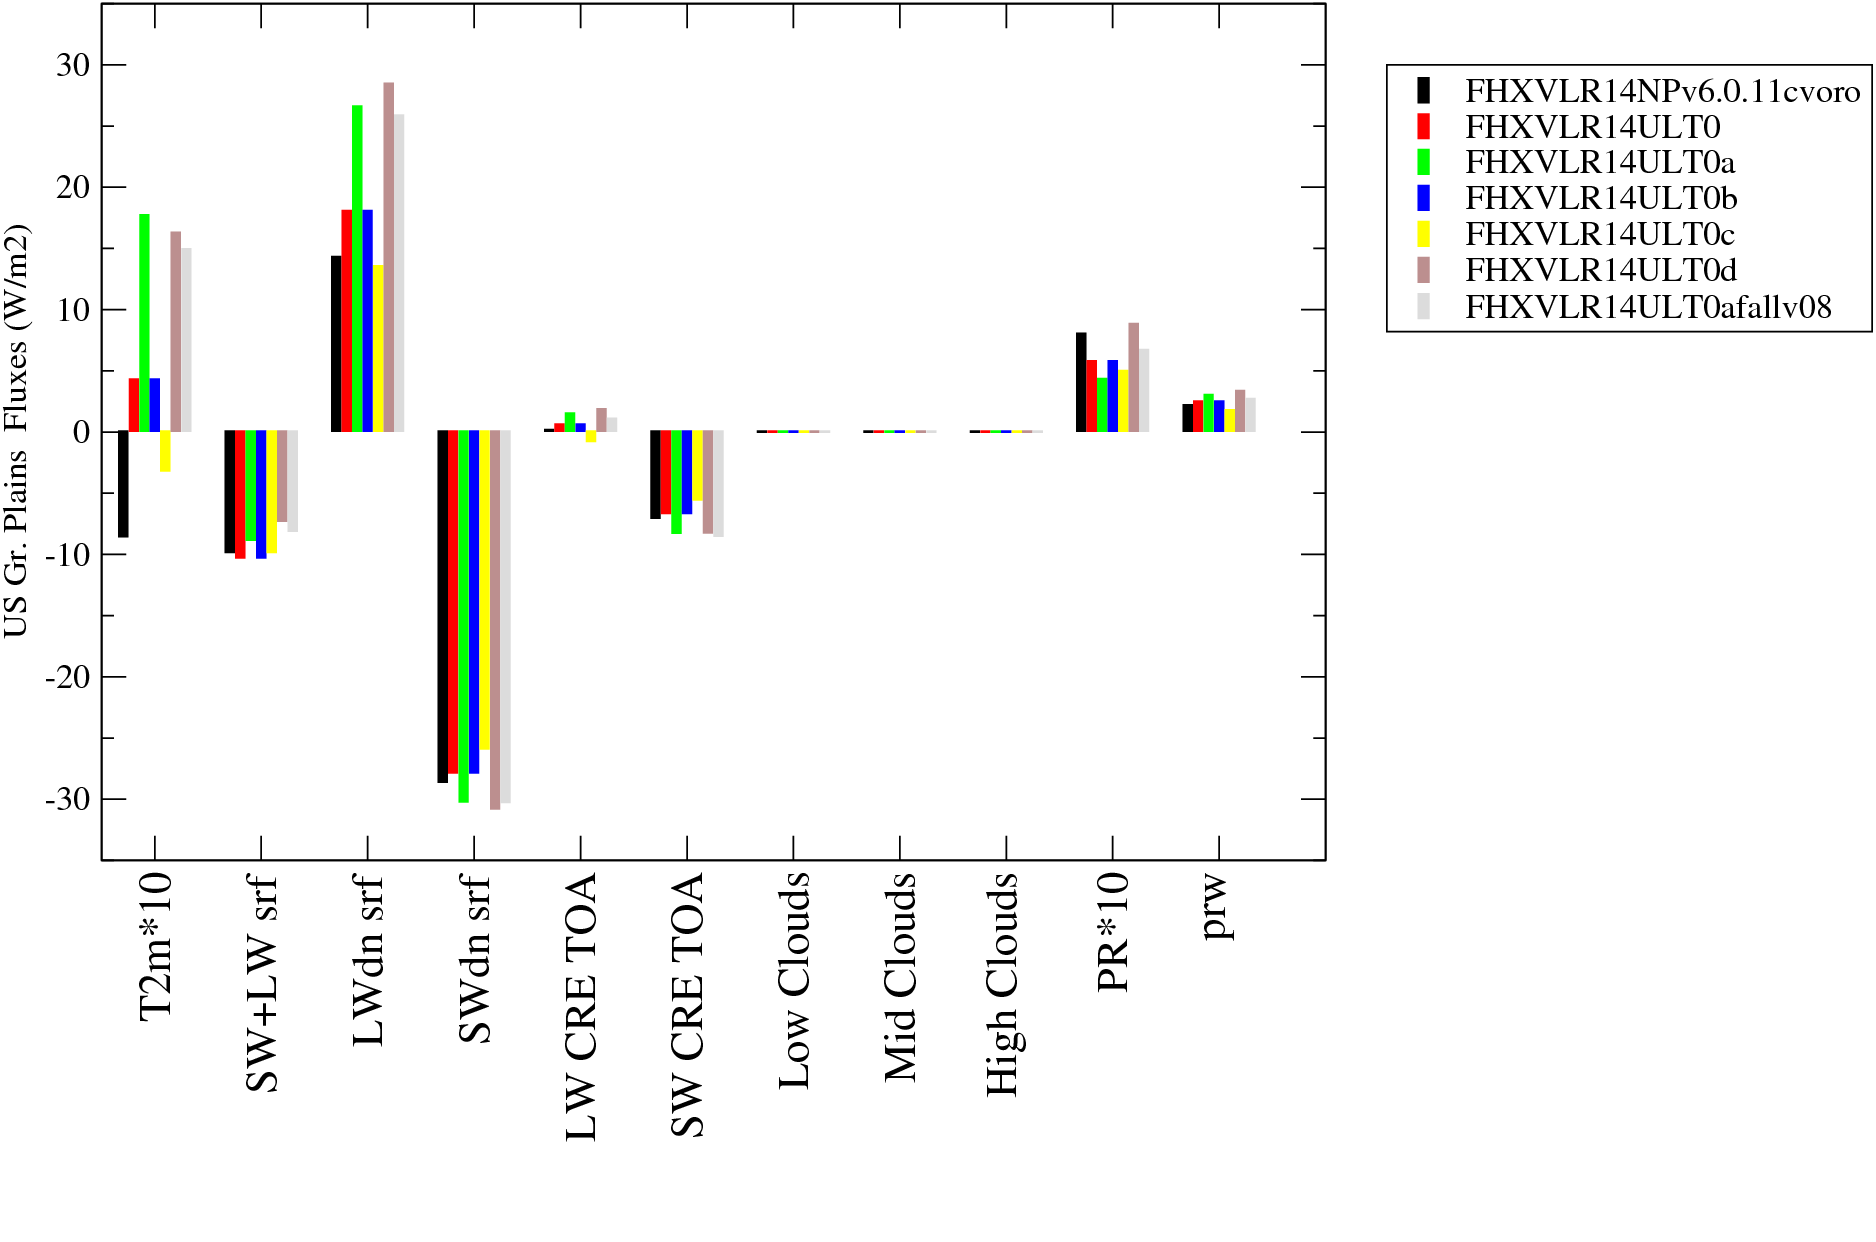
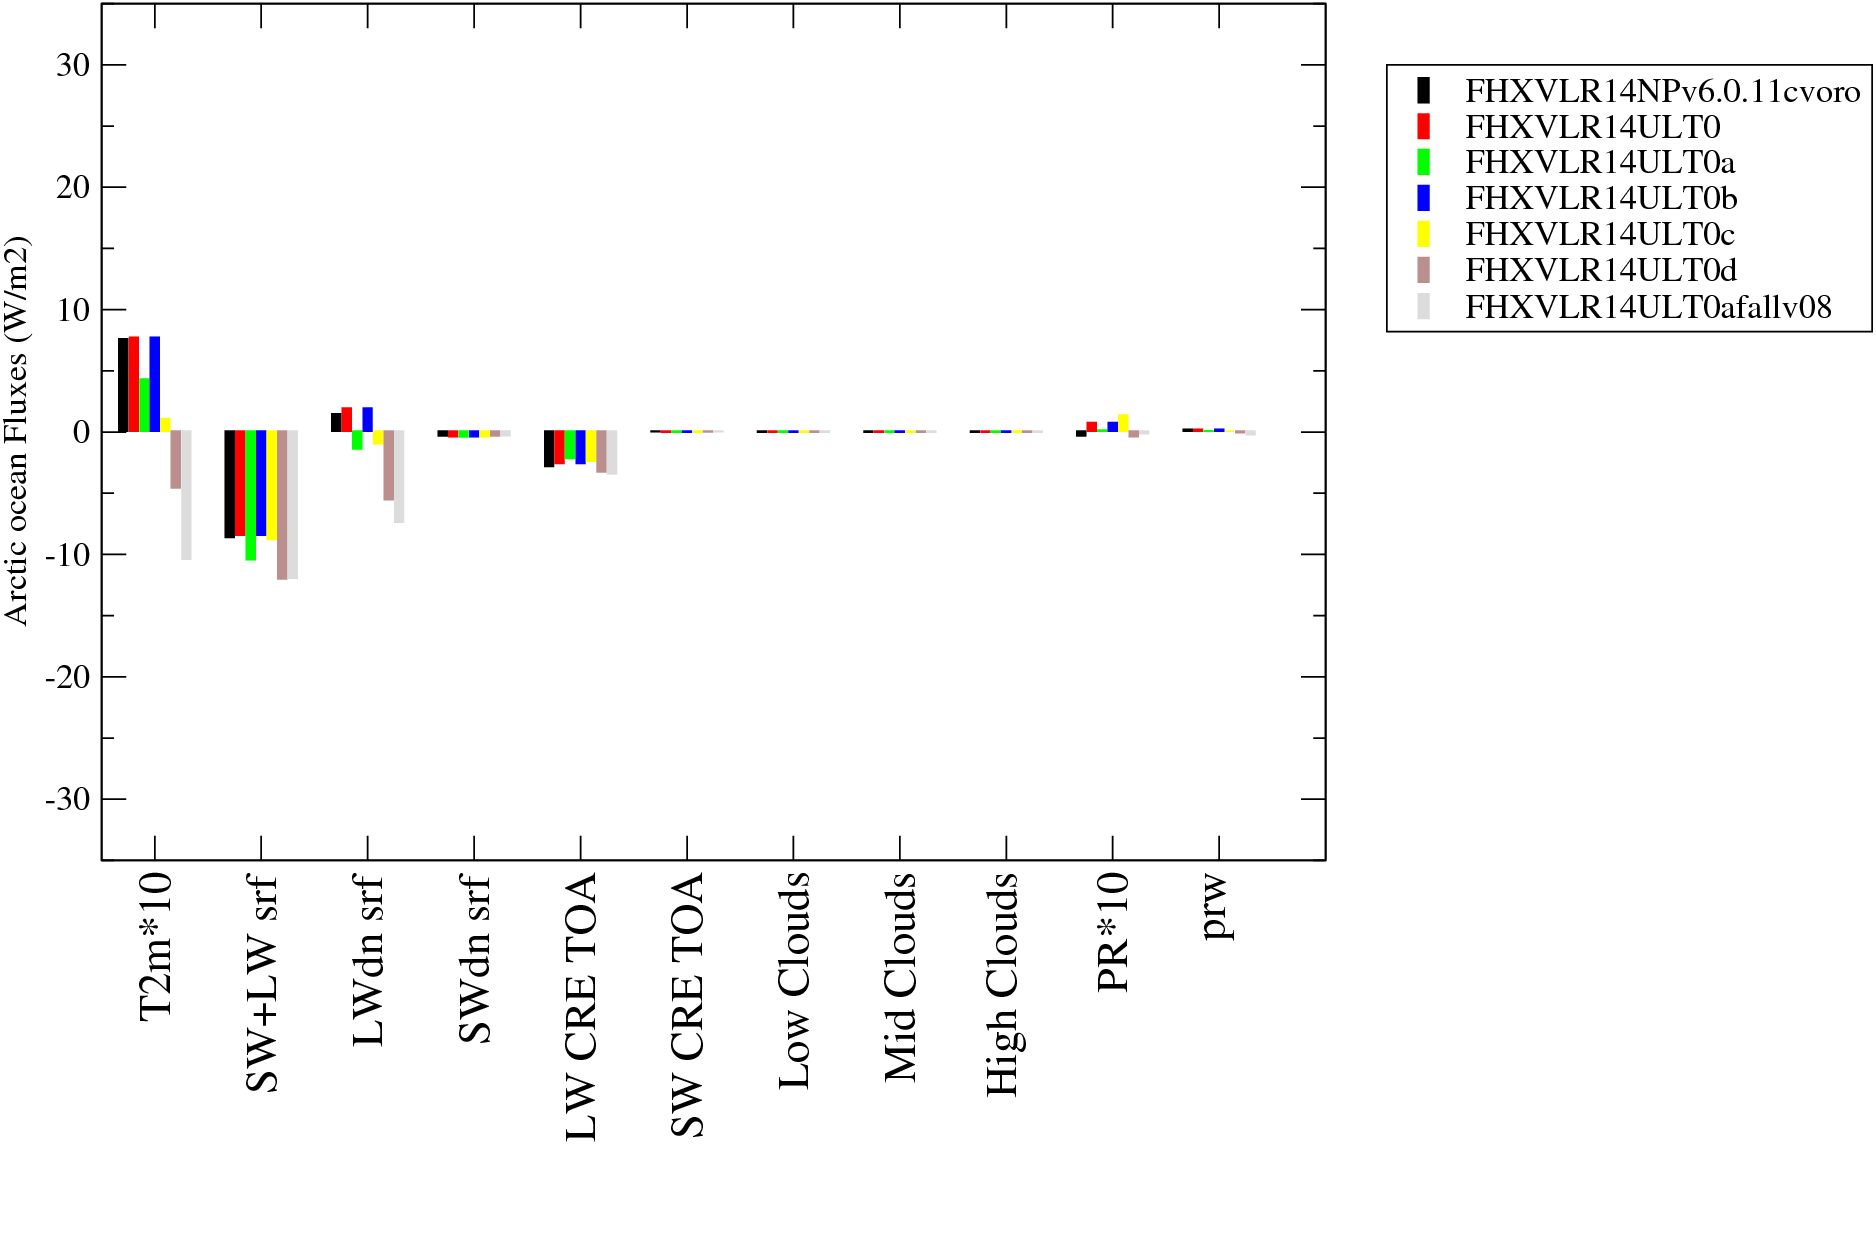
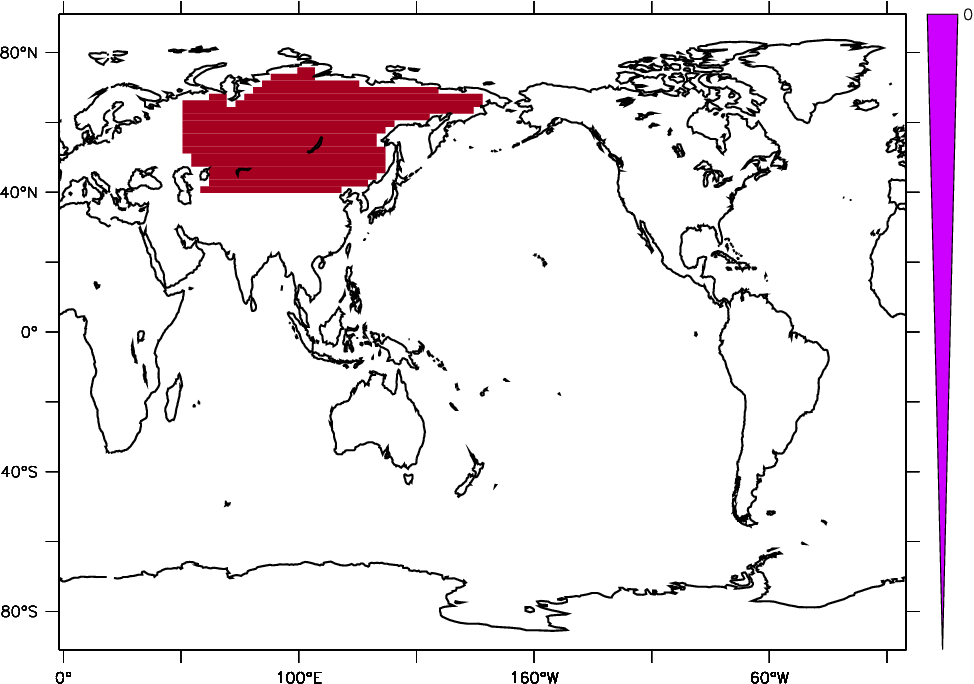
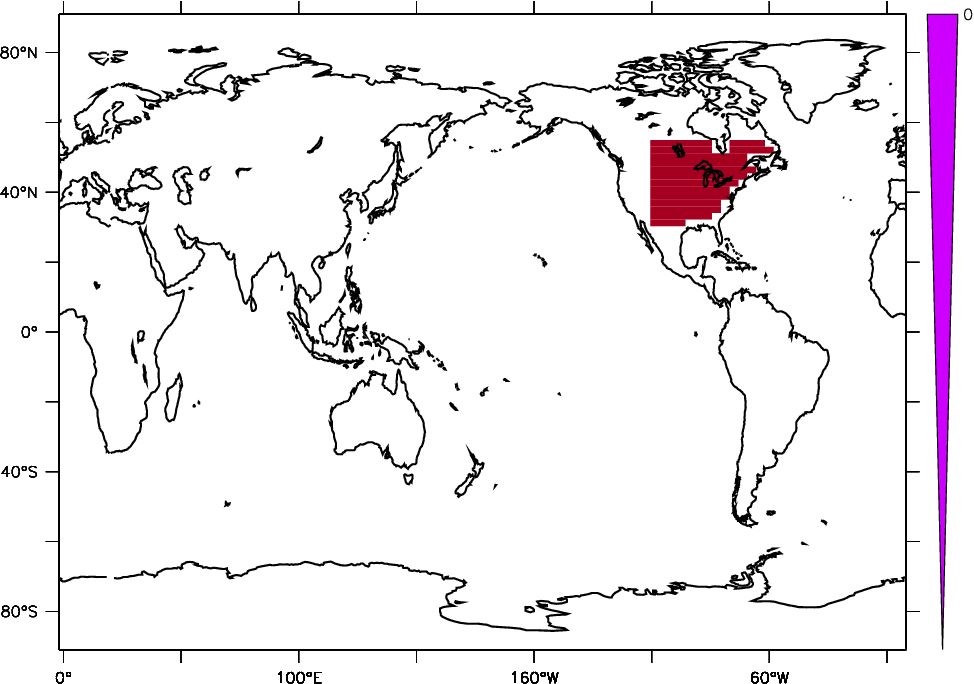
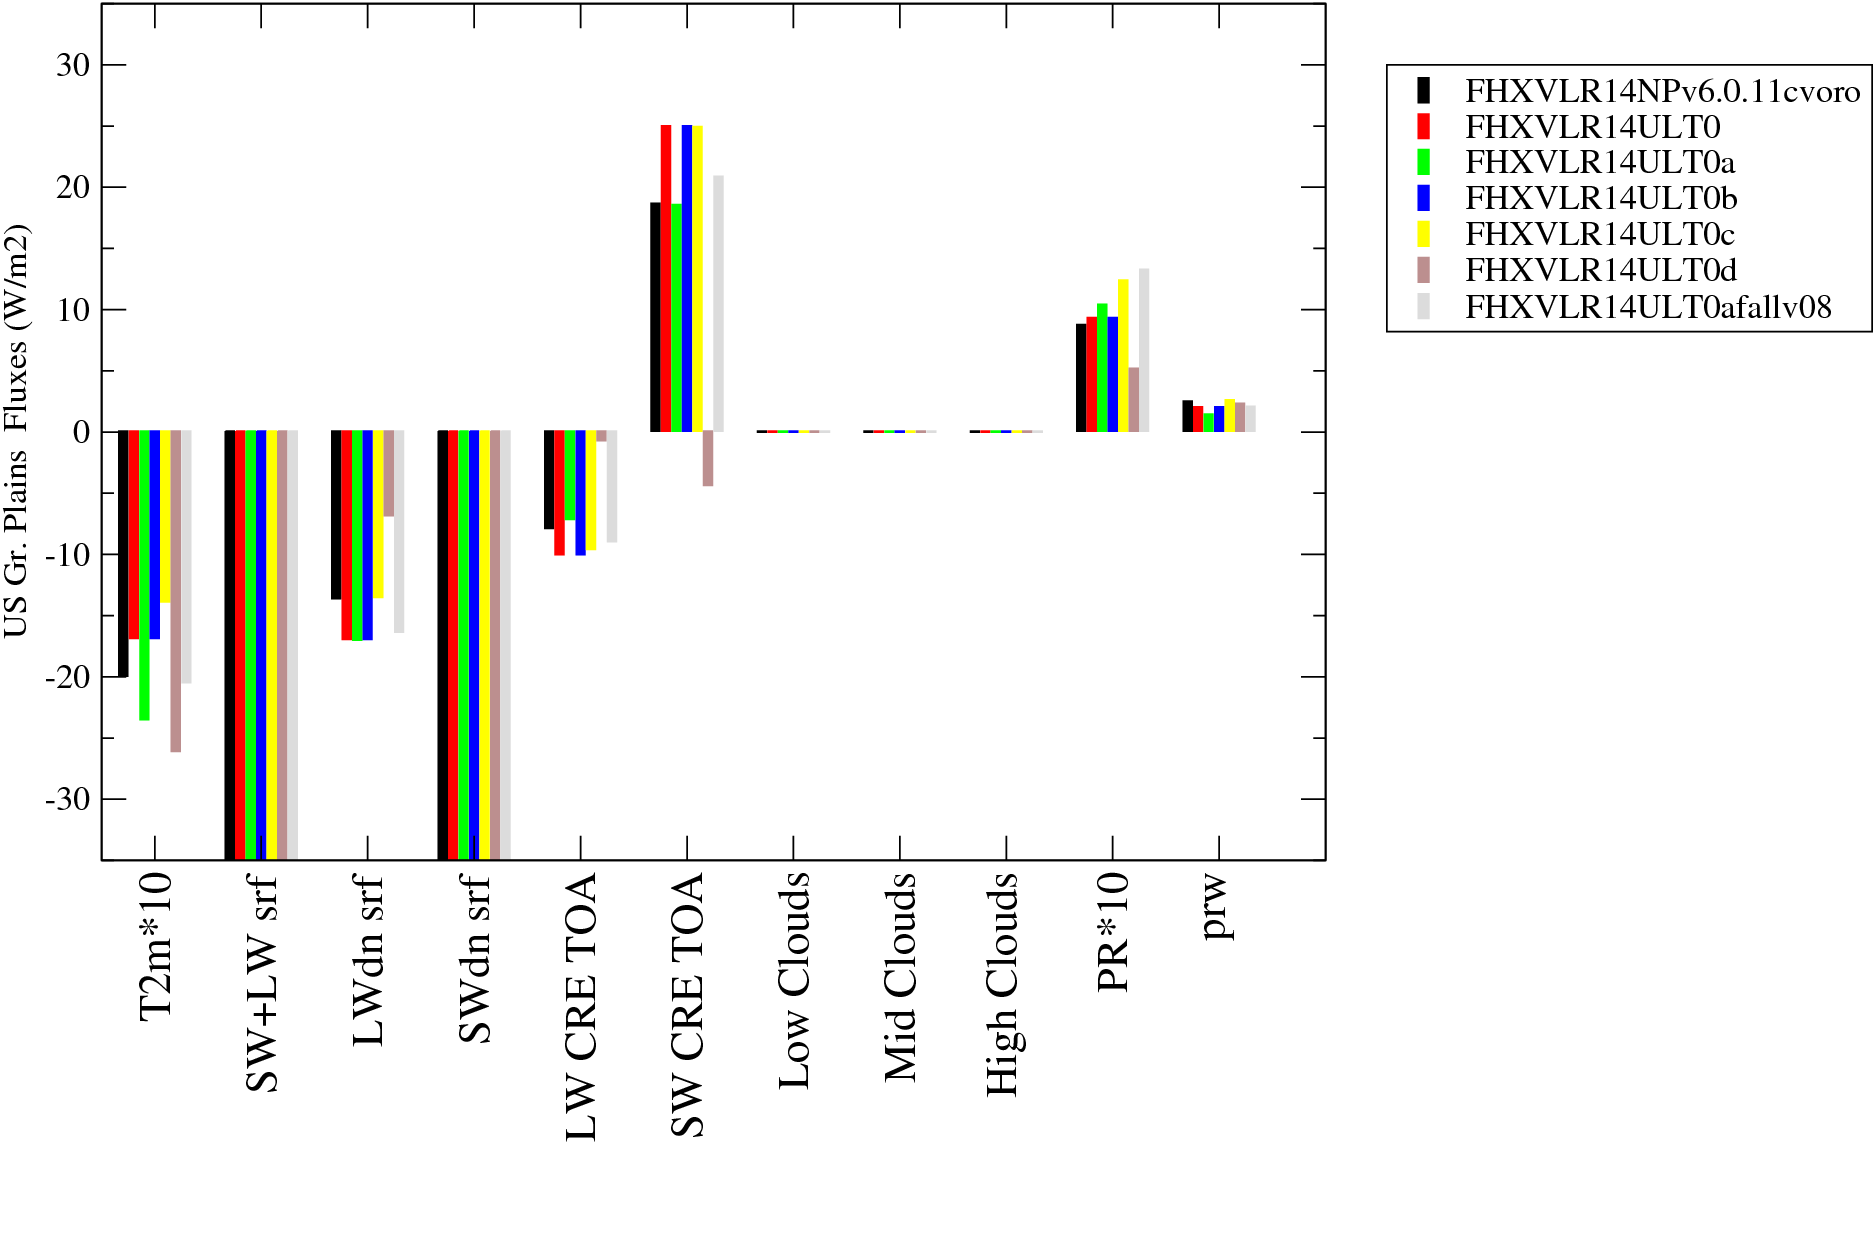
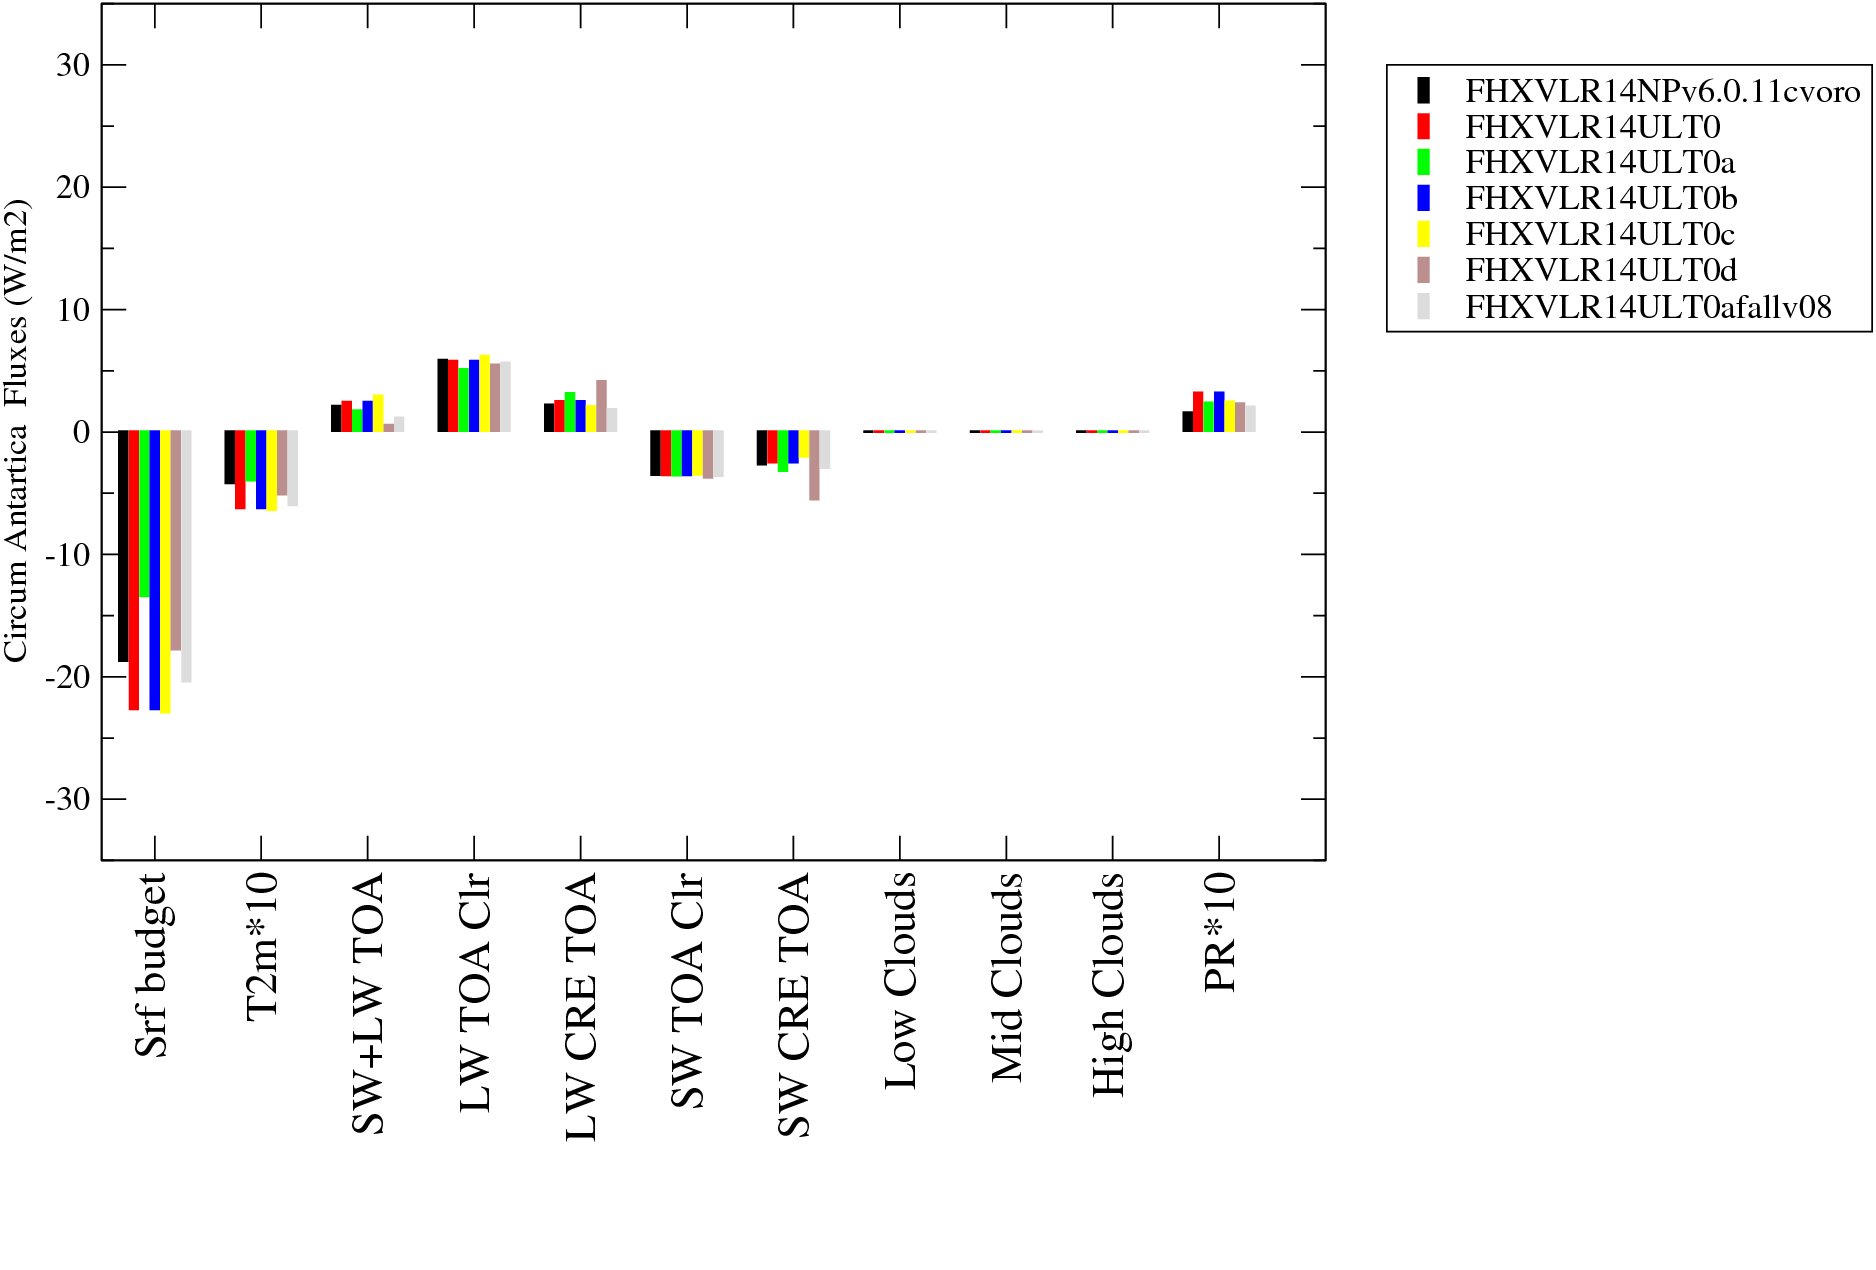
| Siberia | US gr. plains | Arctic | N. Atlantic | Circum Antart. |
 |
 |
 |
 |
 |
 |
 |
 |
 |
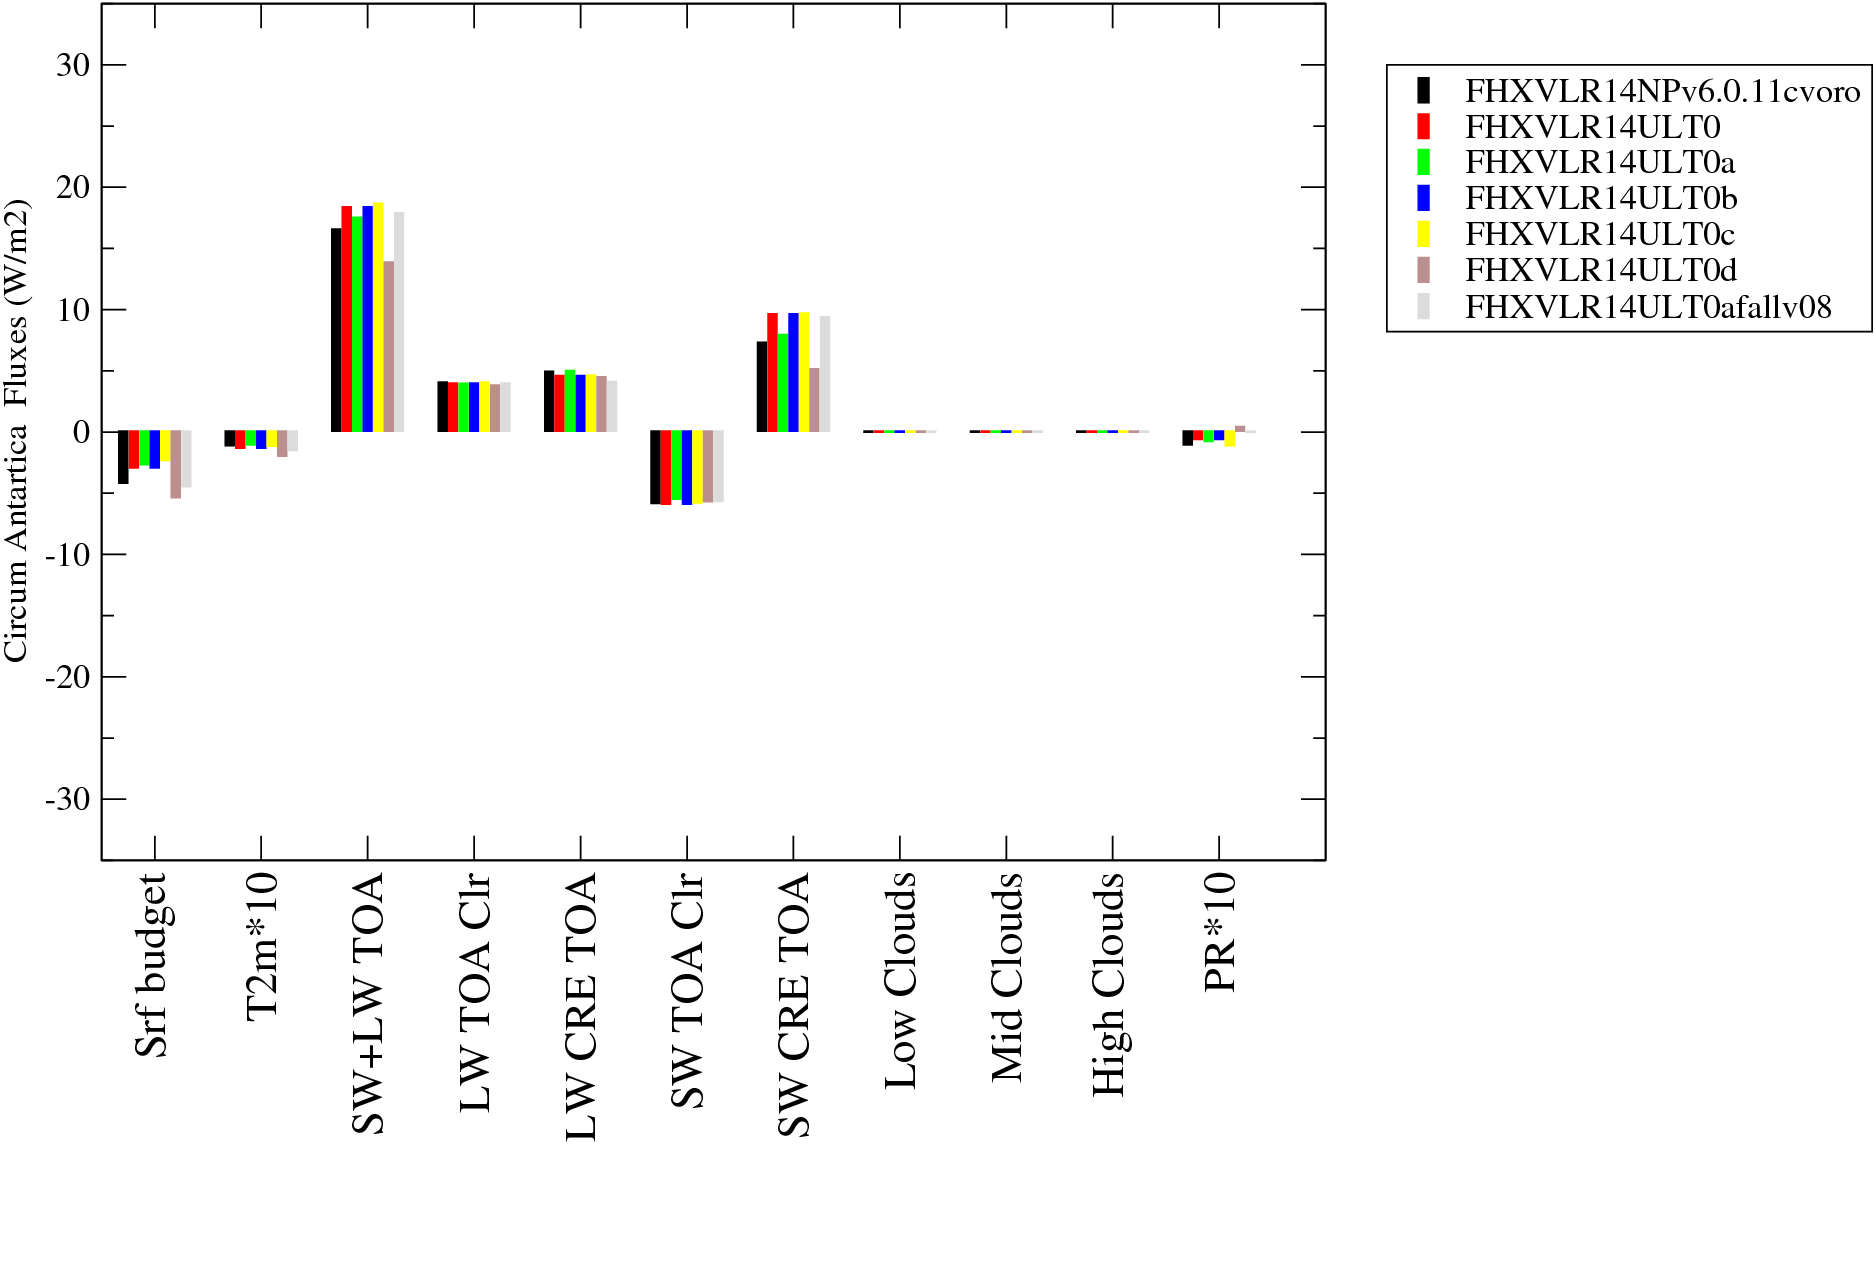 |
| Siberia | US gr. plains | Arctic | N. Atlantic | Circum Antart. |
 |
 |
 |
 |
 |
 |
 |
 |
 |
 |