

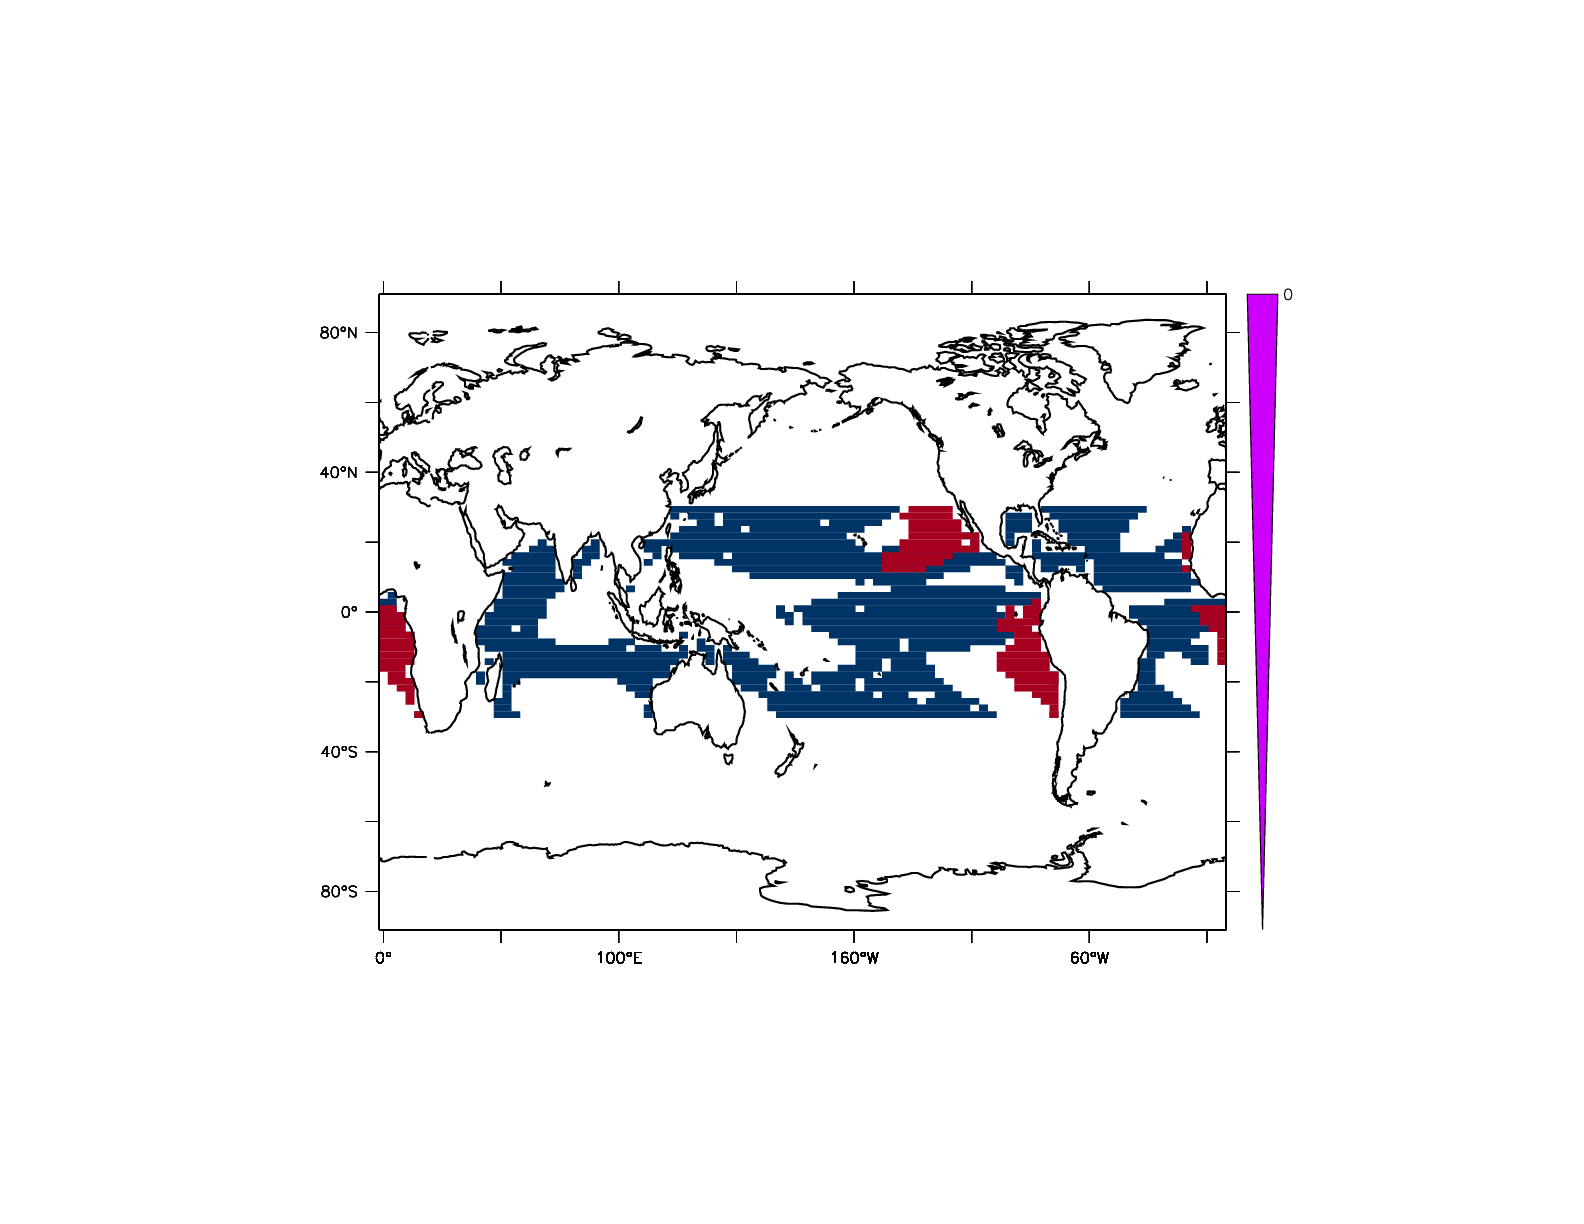
YEAR mean
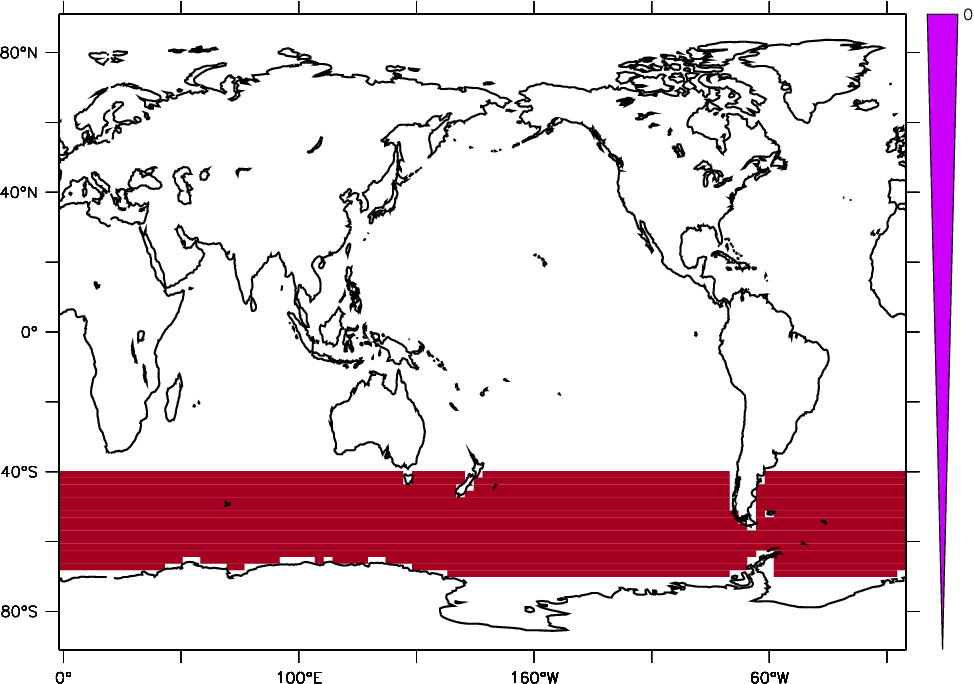
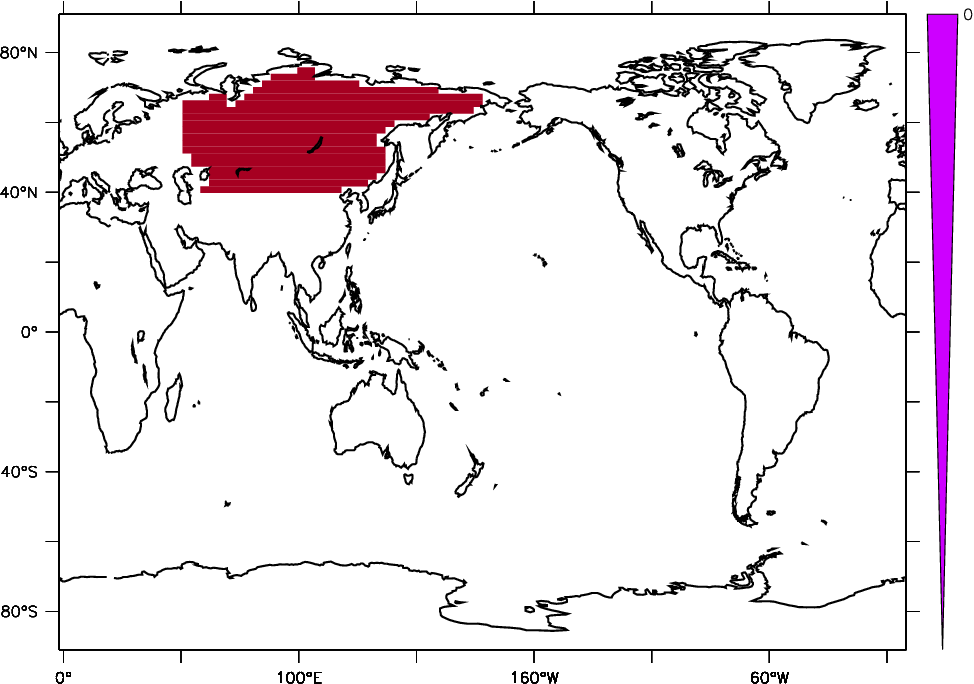
| ETO-Weak YEAR | circA DJF | Sibe JJA |
 |
 |
 |
 |
 |
 |
| RUN (link to outputs) | Atlas YEAR | Atlas --DJF-- | Atlas --JJA-- | Description of the simulation ___________________________ | Period | Name (link to parameters) | bils | rt | rst | rlut | rlutcs | crest | crelt | cret | eva | pr | prw |
| CLIMATOS | 7.097 | 0.7823 | 240.4 | 239.6 | 269.4 | -47.05 | 29.84 | -17.21 | 3.415 | 2.61 | 27.46 | ||||||
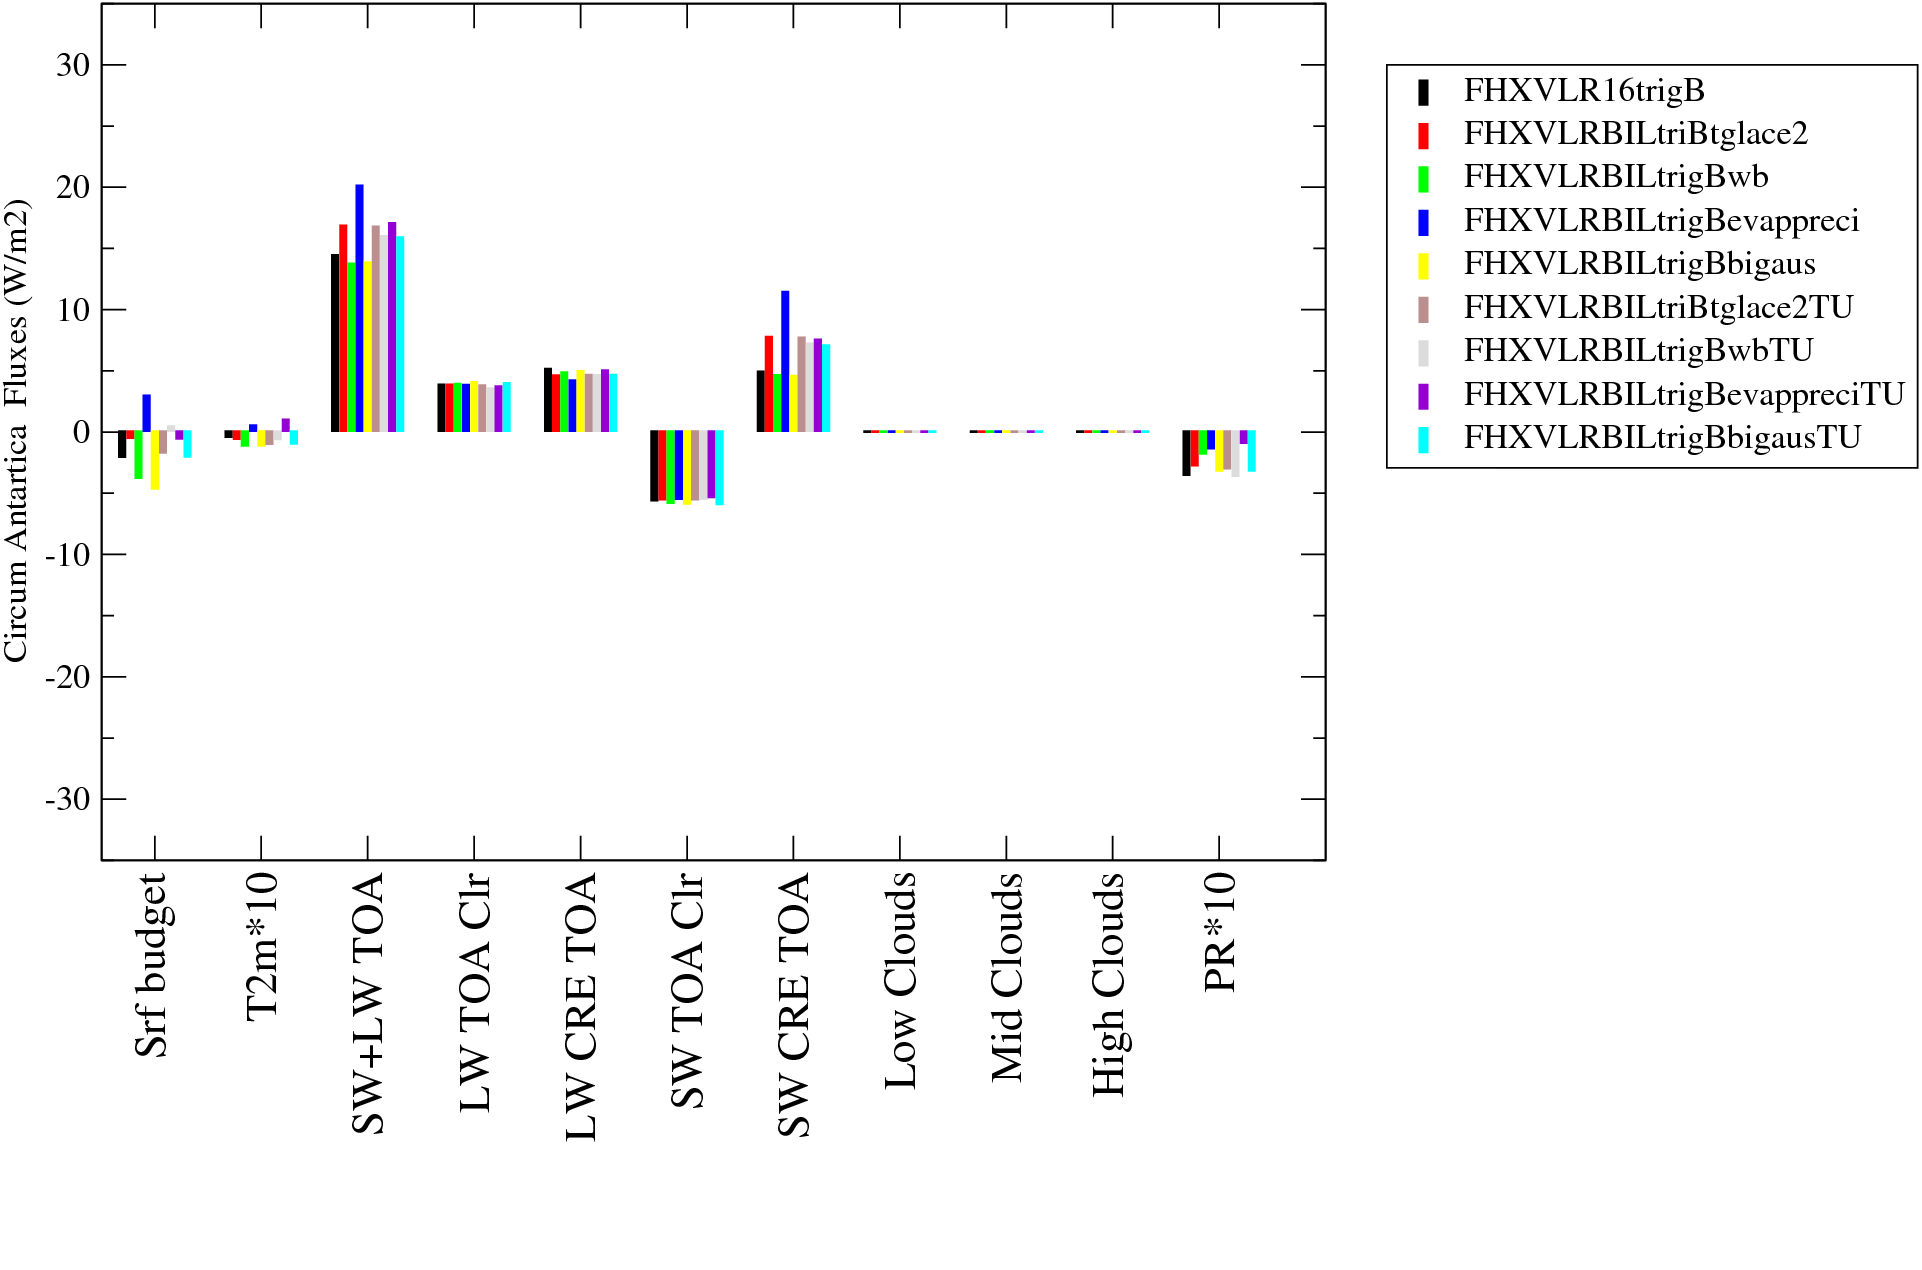
| FHXVLR16trigB | G - - | - - - | - - - | Famille "trig" trigB | 2006_2006 | FHXVLR16trigB | 2.9116 | 2.224 | 236.1 | 233.876 | 259.653 | -48.8394 | 25.777 | -23.0624 | 3.00412 | 24.9541 | |
| FHXVLRBILtriBtglace2 | G - - | - - - | - - - | FHXVLRBILtriBtglace2 | 2006_2006 | FHXVLRBILtriBtglace2 | 3.3267 | 2.616 | 236.362 | 233.746 | 259.695 | -48.6298 | 25.949 | -22.6808 | 3.01222 | 25.0822 | |
| FHXVLRBILtrigBwb | G - - | - - - | - - - | FHXVLRBILtrigBwb | 2006_2006 | FHXVLRBILtrigBwb | 2.1688 | 1.577 | 234.972 | 233.395 | 259.527 | -49.9049 | 26.132 | -23.7729 | 2.99481 | 25.1307 | |
| FHXVLRBILtrigBevappreci | G - - | - - - | - - - | FHXVLRBILtrigBevappreci | 2006_2006 | FHXVLRBILtrigBevappreci | 4.5518 | 4.035 | 238.417 | 234.382 | 259.751 | -46.593 | 25.369 | -21.224 | 3.11145 | 24.7866 | |
| FHXVLRBILtrigBbigaus | G - - | - - - | - - - | FHXVLRBILtrigBbigaus | 2006_2006 | FHXVLRBILtrigBbigaus | 1.9683 | 1.293 | 235.292 | 233.999 | 259.606 | -49.5618 | 25.607 | -23.9548 | 3.00761 | 24.8794 | |
| FHXVLRBILtriBtglace2TU | G - - | - - - | - - - | FHXVLRBILtriBtglace2 reTUne | 2006_2006 | FHXVLRBILtriBtglace2TU | 2.8915 | 2.307 | 236.112 | 233.805 | 259.81 | -48.8513 | 26.005 | -22.8463 | 3.01193 | 24.9346 | |
| FHXVLRBILtrigBwbTU | G - - | - - - | - - - | FHXVLRBILtrigBwb reTUne | 2006_2006 | FHXVLRBILtrigBwbTU | 3.1038 | 2.392 | 236.089 | 233.697 | 259.613 | -48.8629 | 25.916 | -22.9469 | 2.9935 | 25.1866 | |
| FHXVLRBILtrigBevappreciTU | G - - | - - - | - - - | FHXVLRBILtrigBevappreci reTUne | 2006_2006 | FHXVLRBILtrigBevappreciTU | 2.8745 | 2.341 | 236.371 | 234.03 | 259.873 | -48.6404 | 25.843 | -22.7974 | 3.12417 | 24.7764 | |
| FHXVLRBILtrigBbigausTU | G - - | - - - | - - - | FHXVLRBILtrigBbigaus reTUne | 2006_2006 | FHXVLRBILtrigBbigausTU | 2.8617 | 2.309 | 236.701 | 234.392 | 259.748 | -48.2506 | 25.356 | -22.8946 | 3.00312 | 24.9341 | |
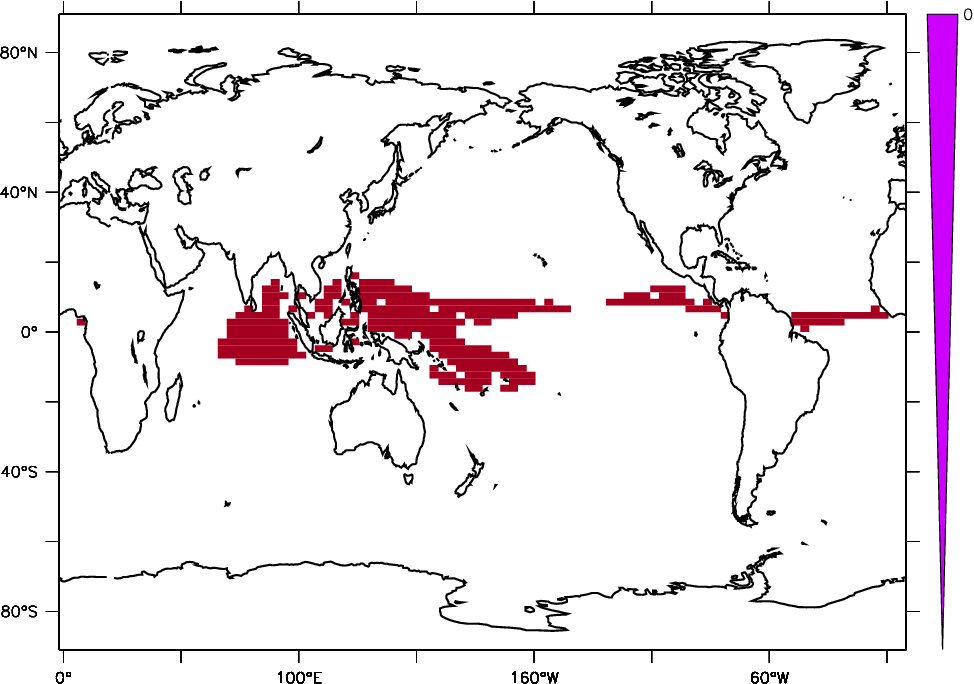
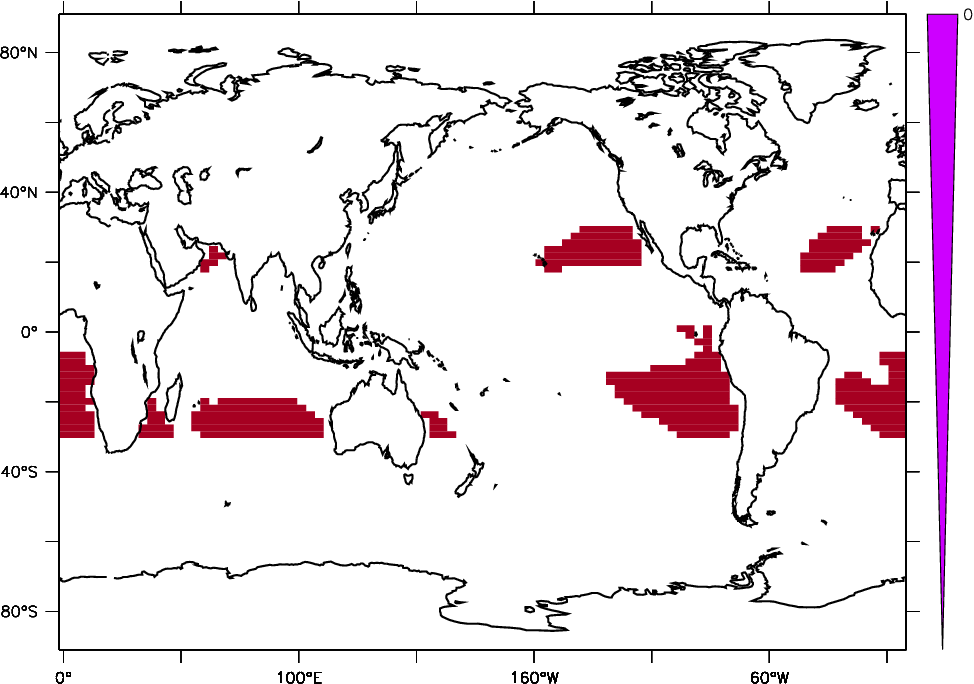
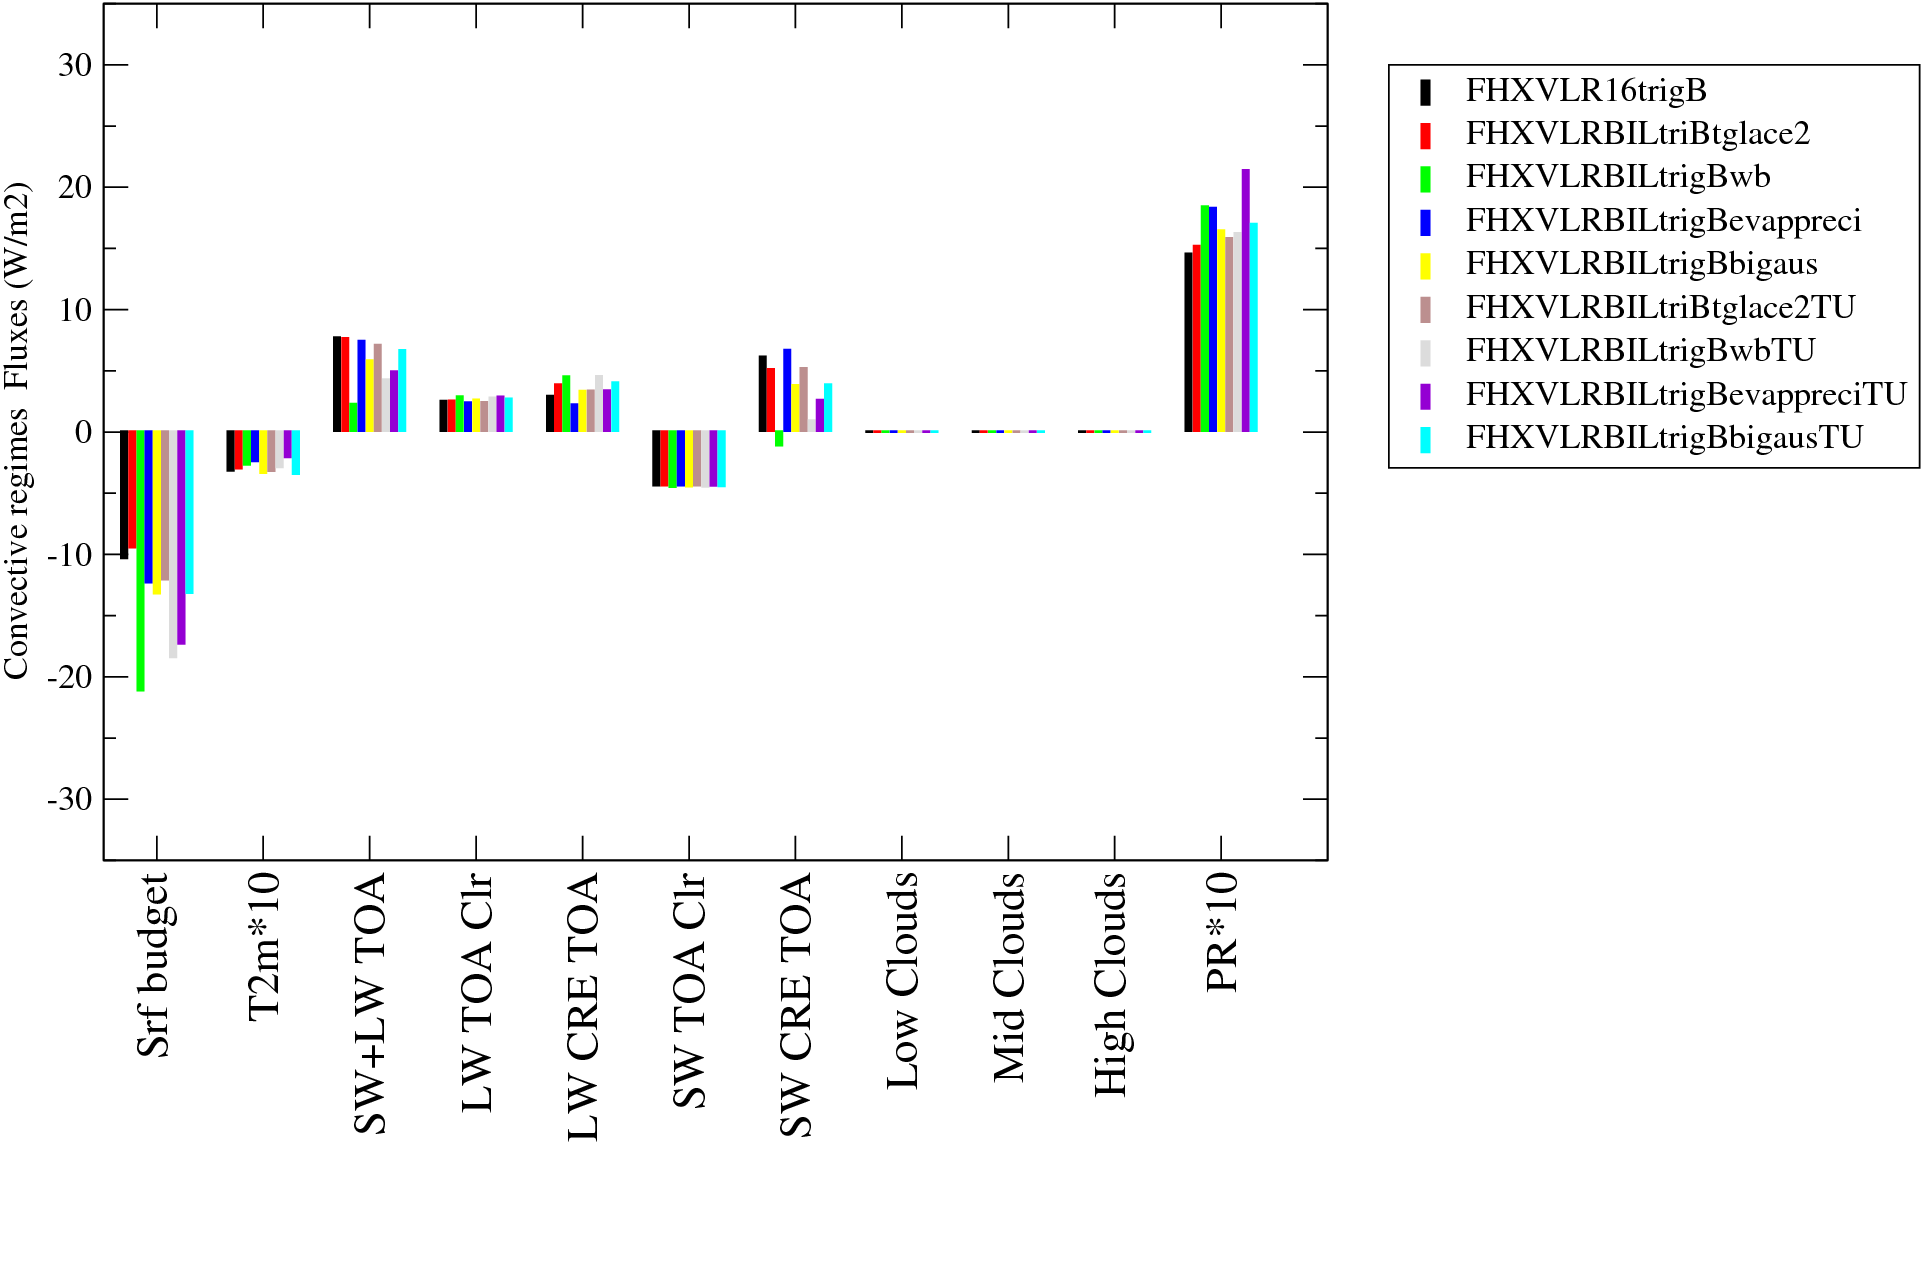
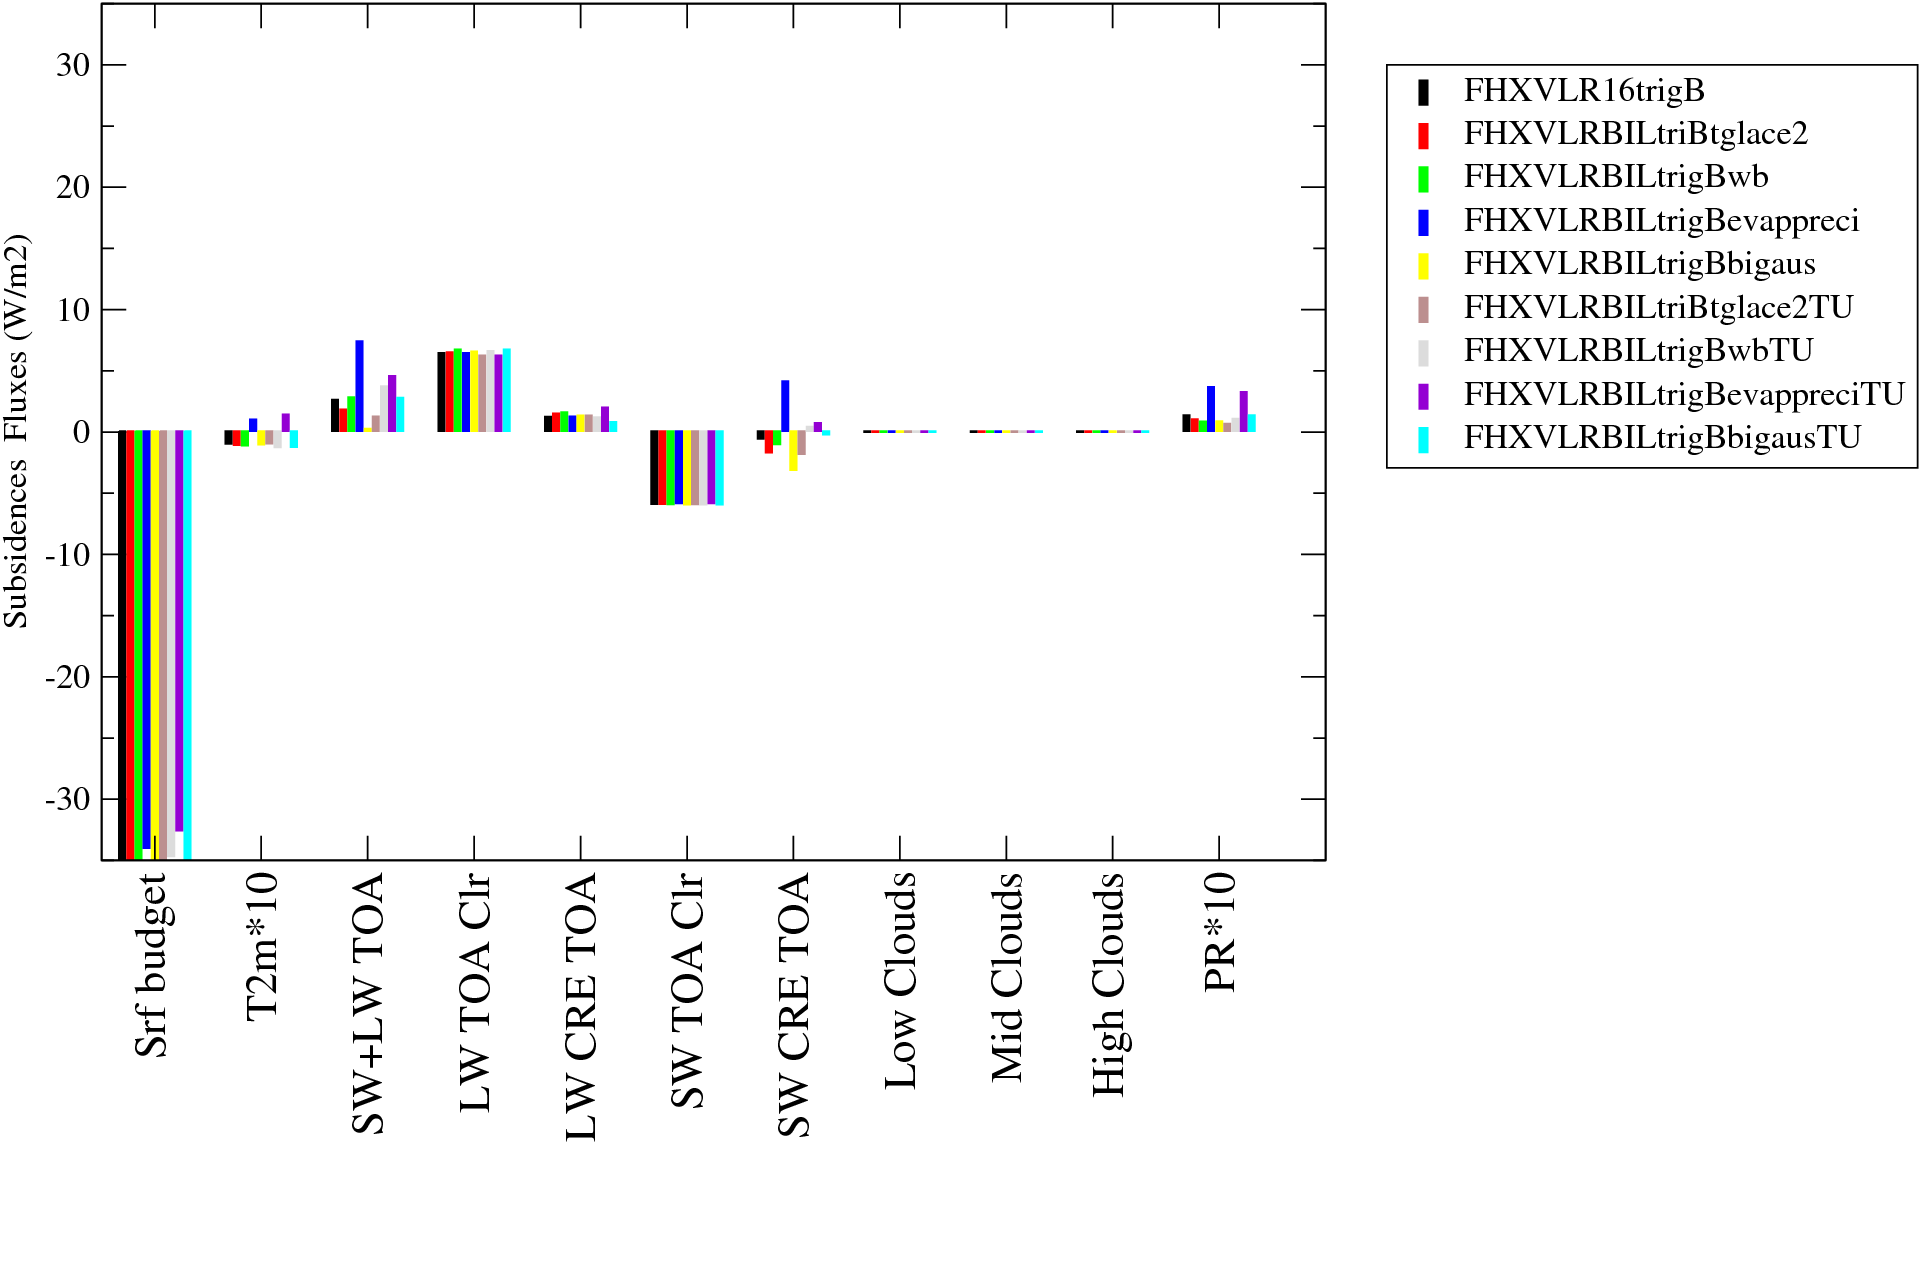
| Convective | Weak | Subsidence | ||||||
|
|
|
||||||
|
|
|
||||||
| ETO-Weak YEAR | circA DJF | Sibe JJA |
|
|
|
|
|
|