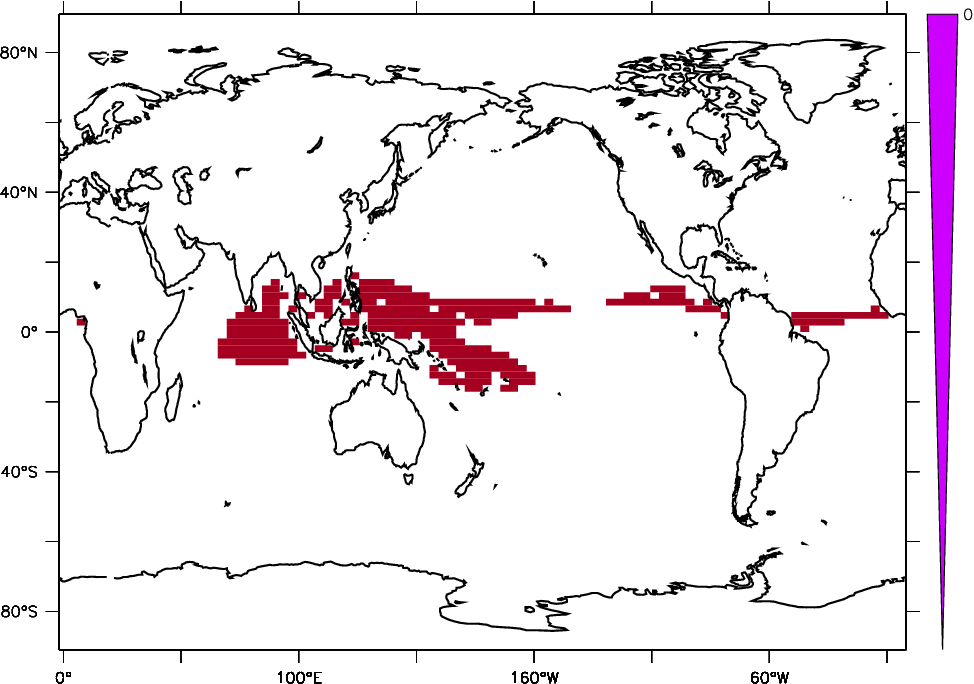
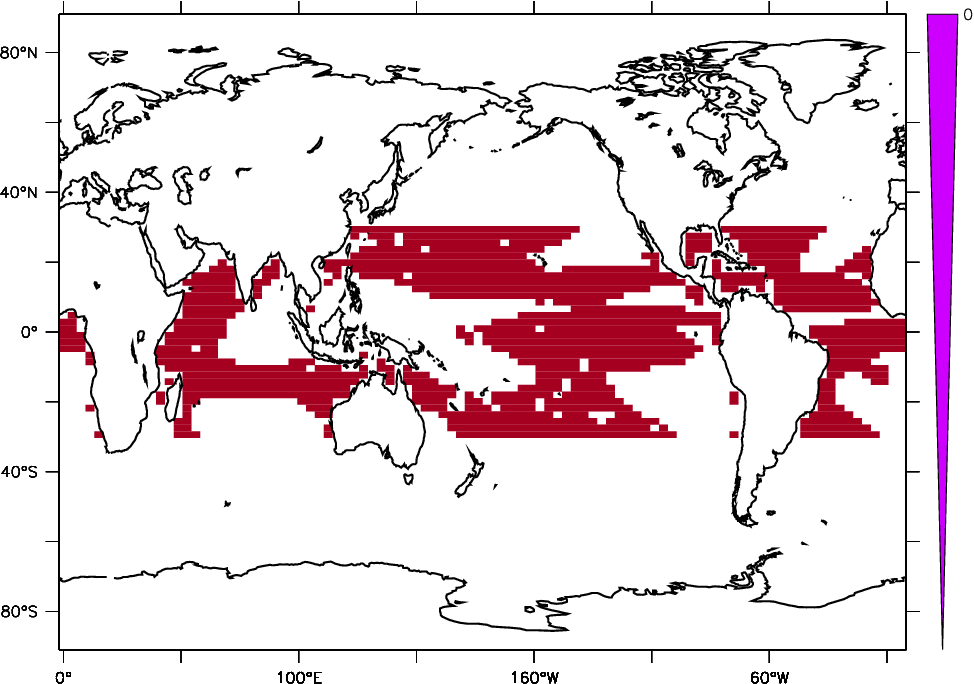

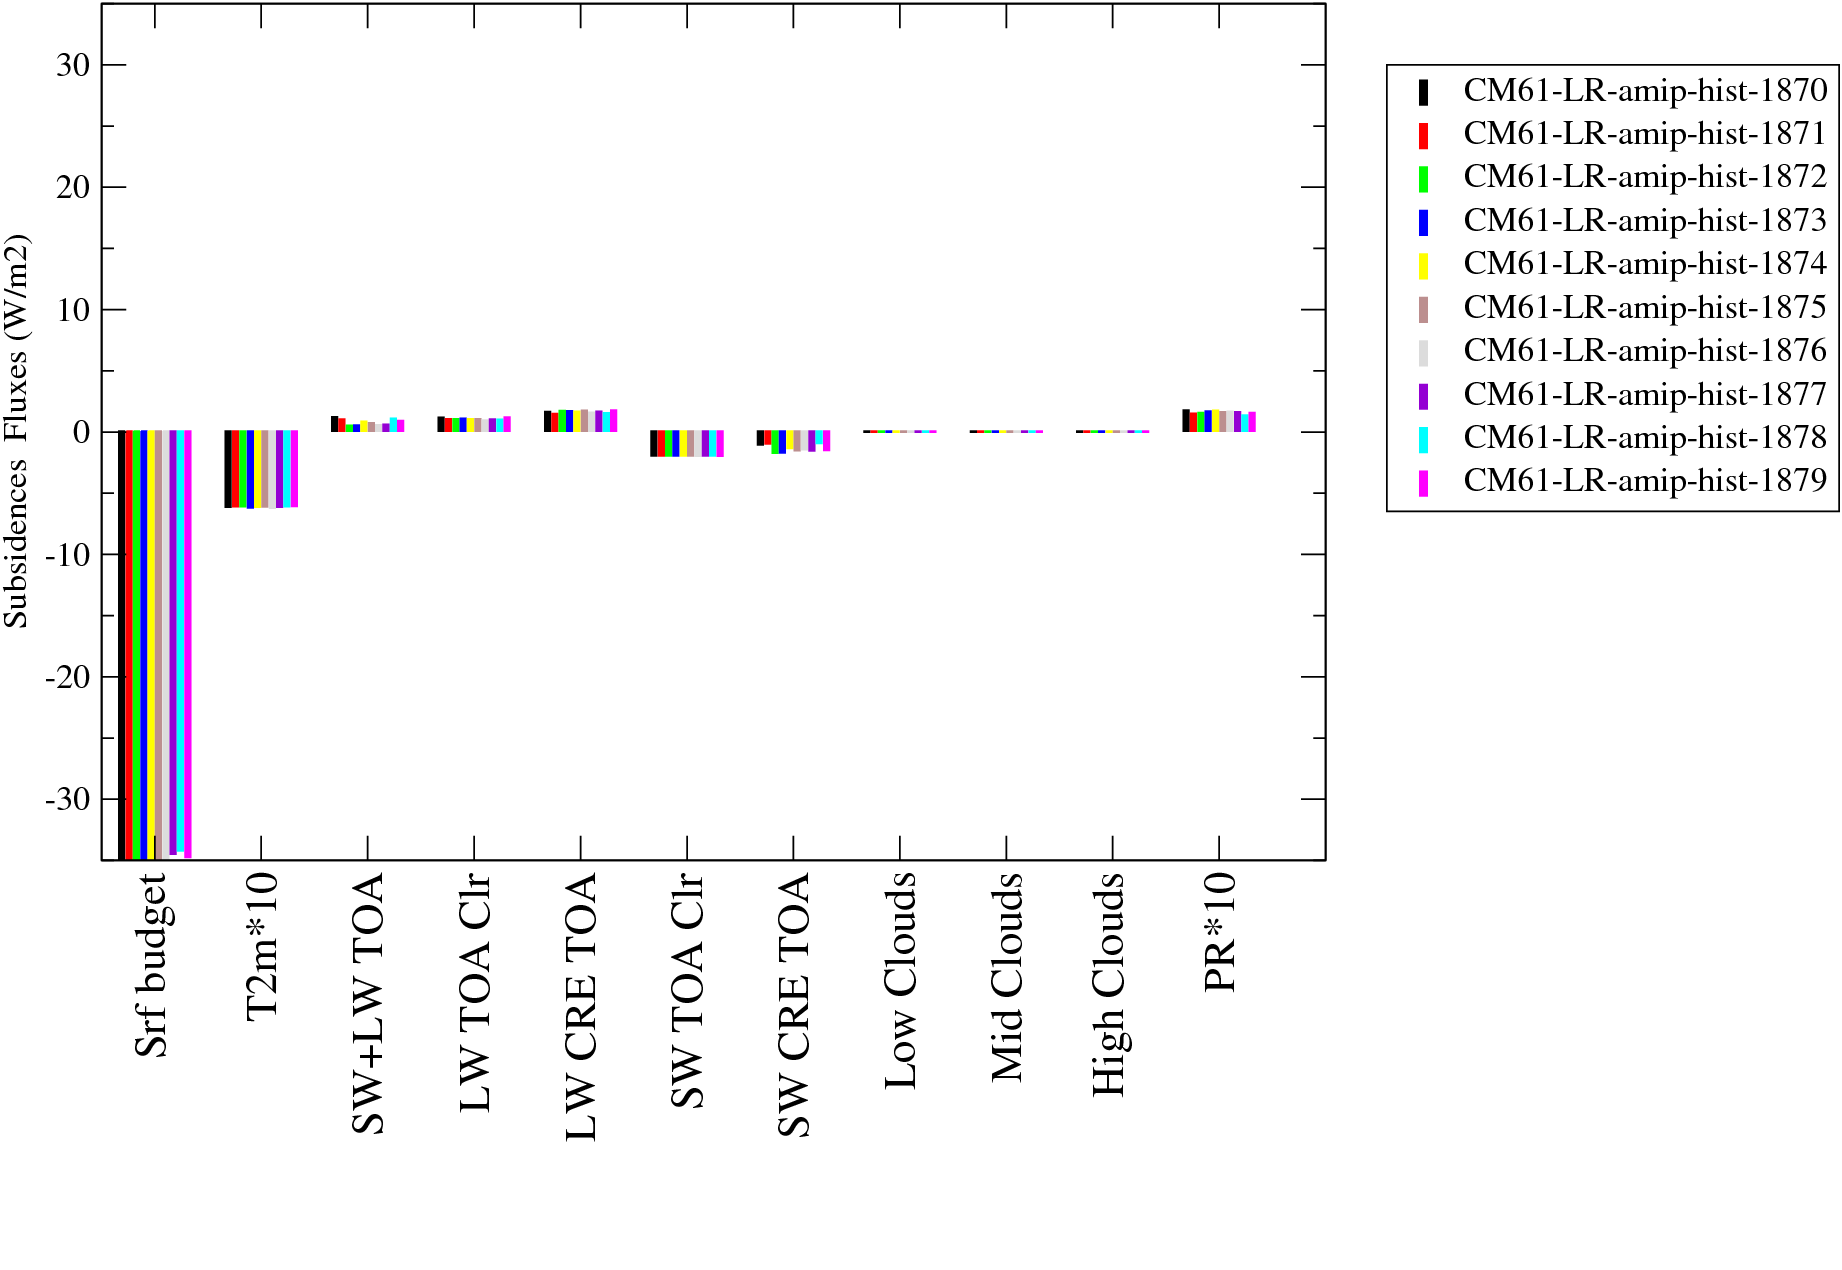
YEAR mean
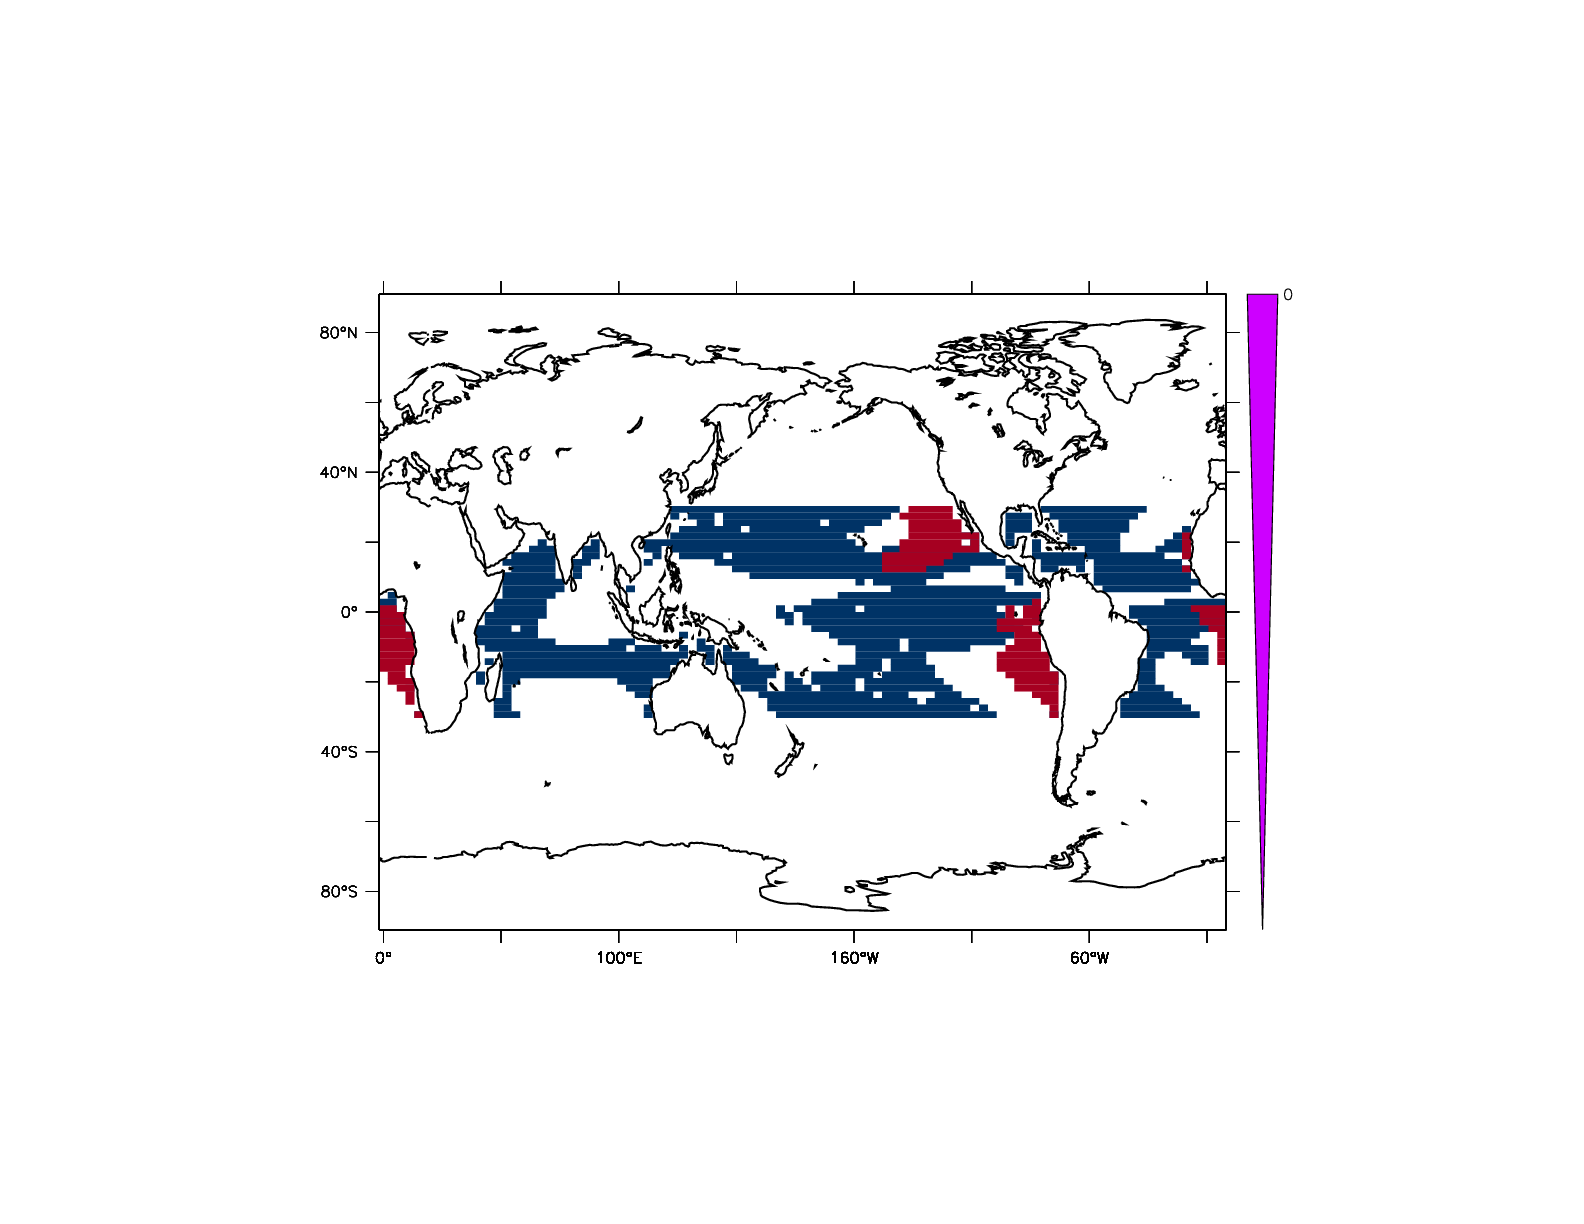
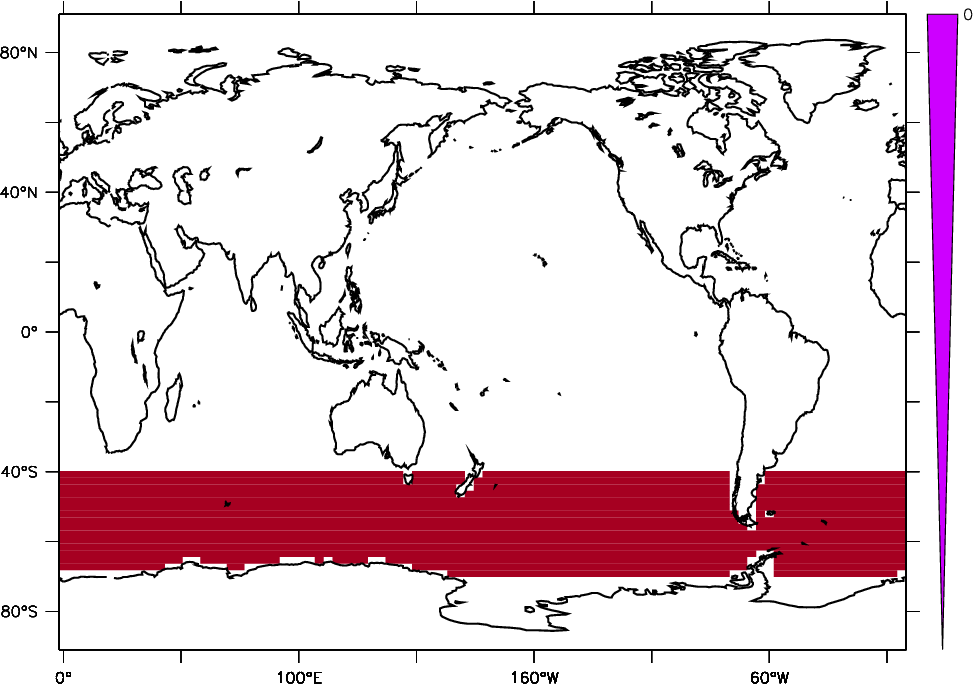
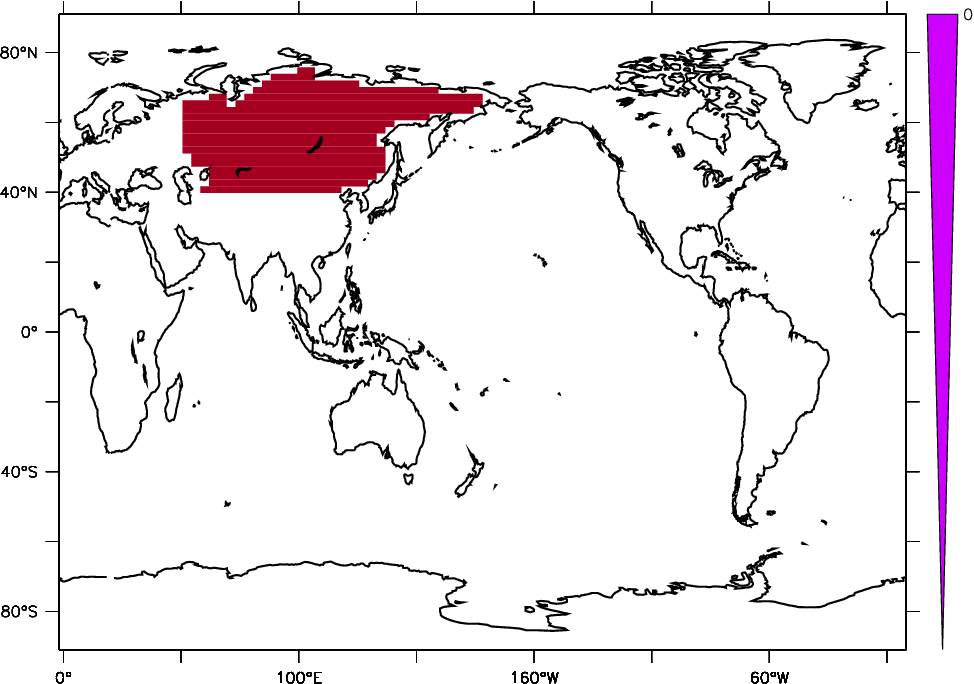
| ETO-Weak YEAR | circA DJF | Sibe JJA |
 |
 |
 |
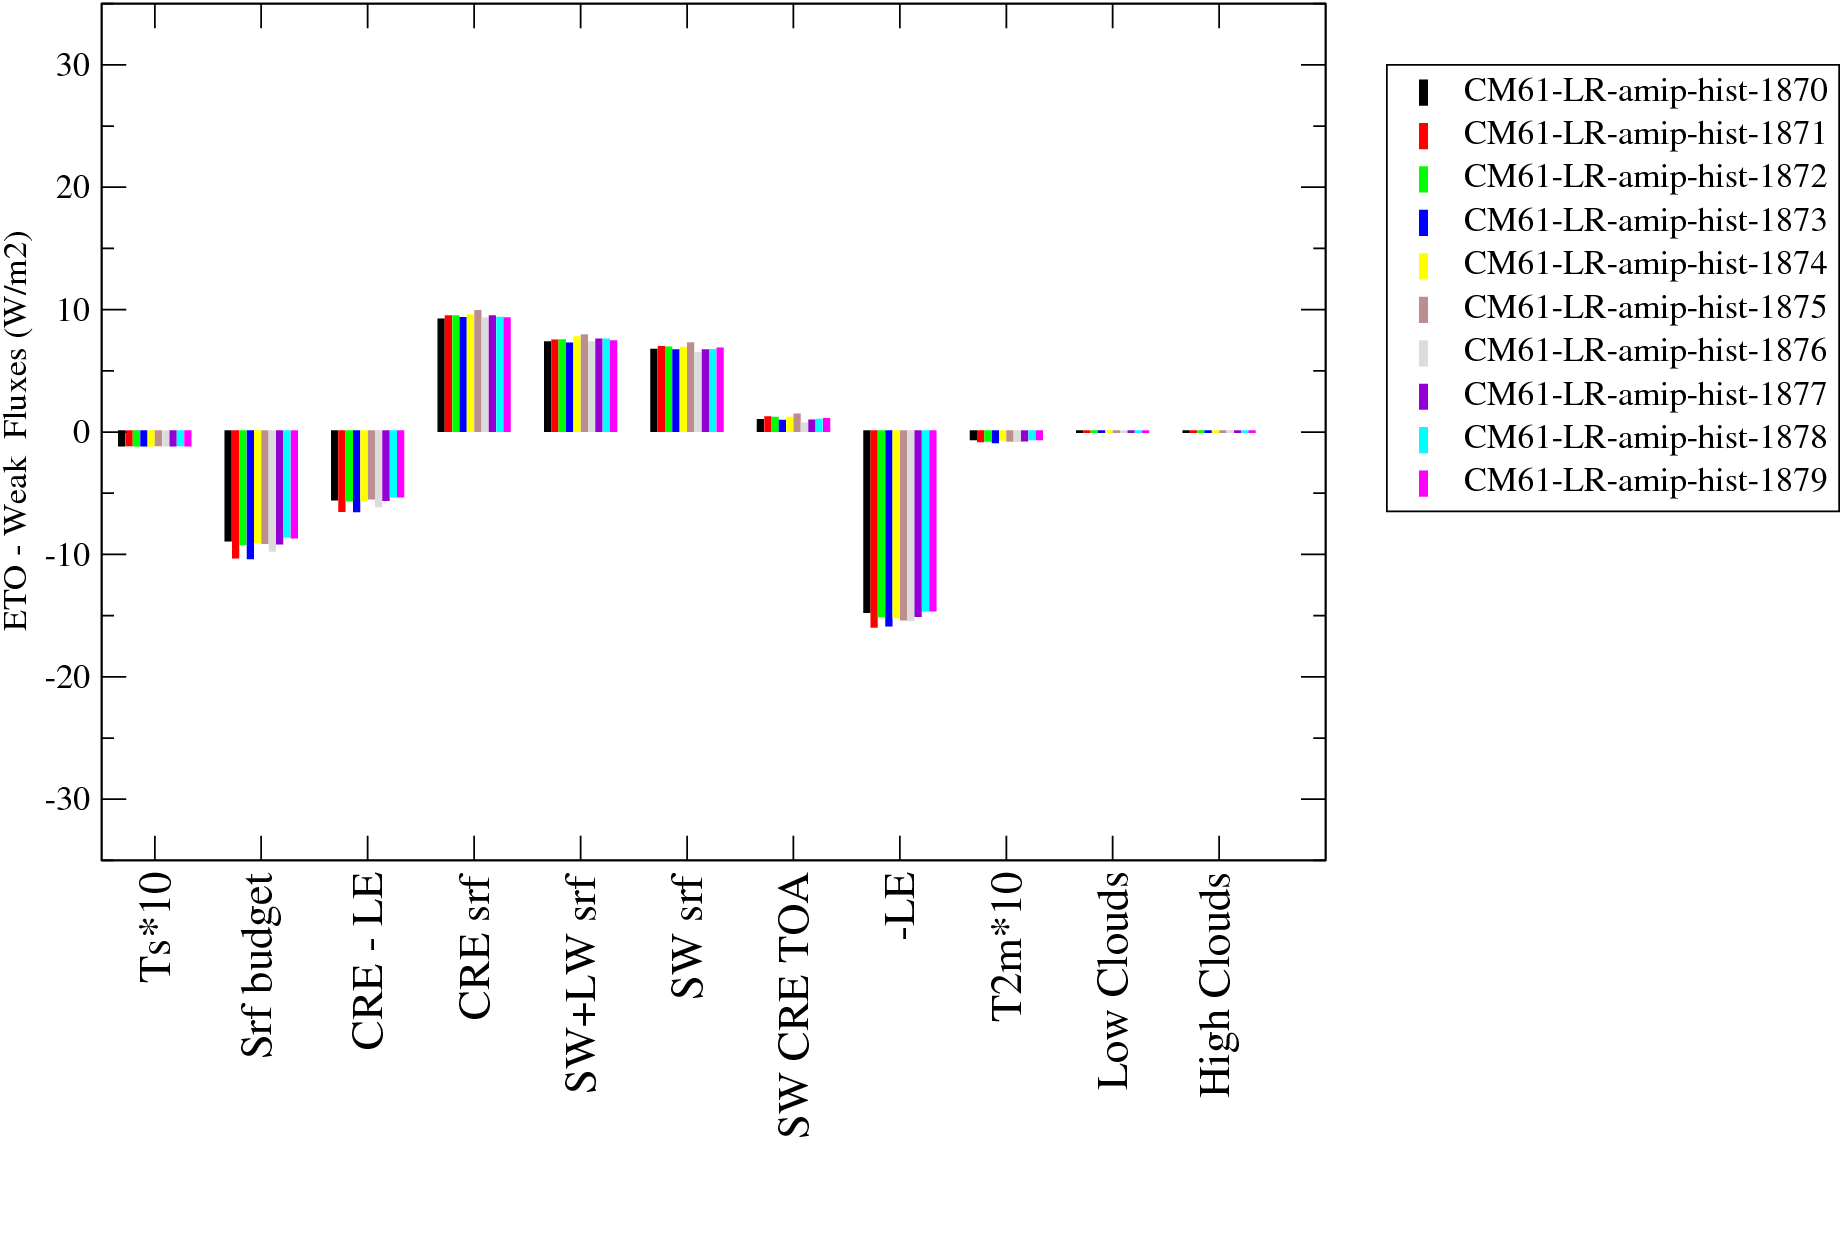 |
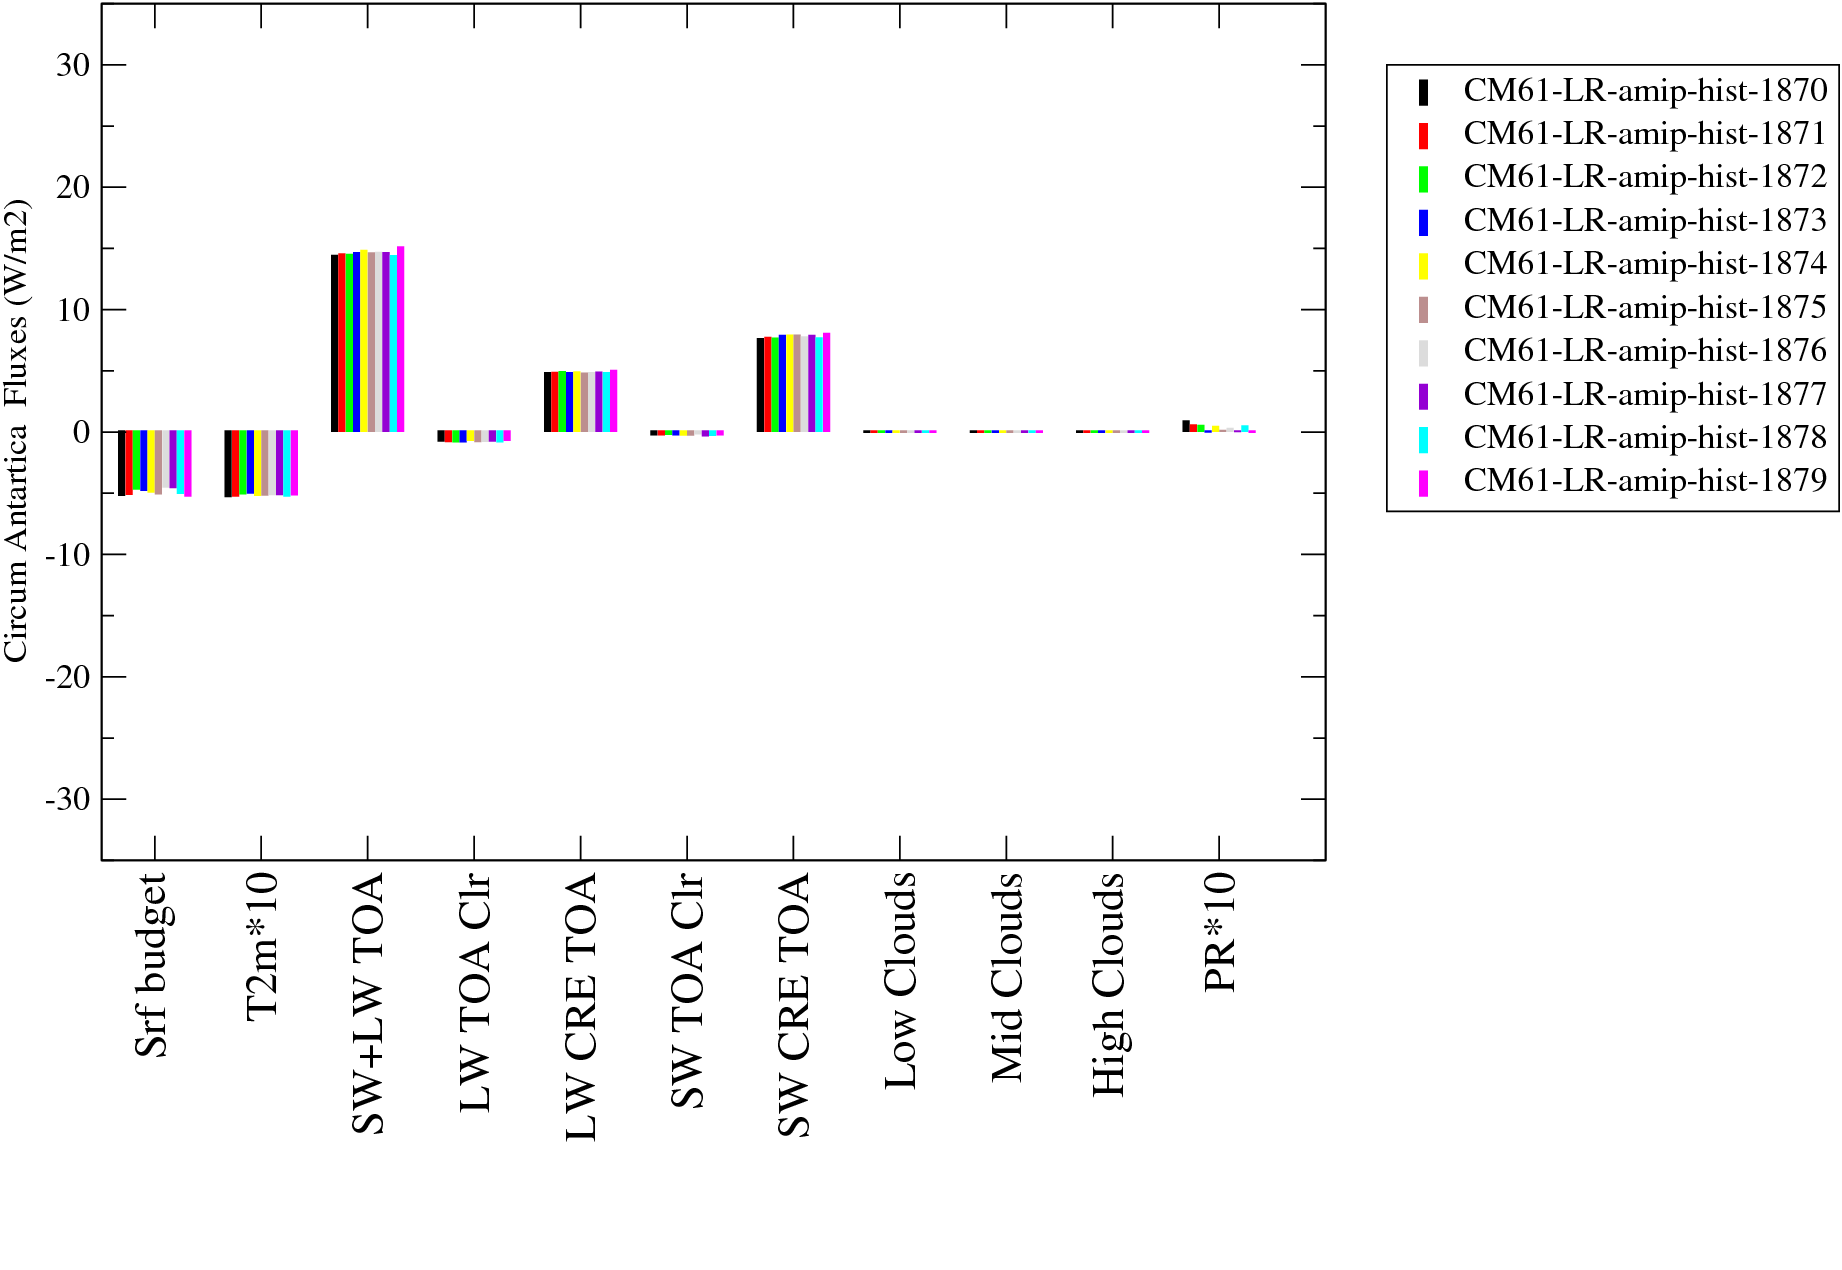 |
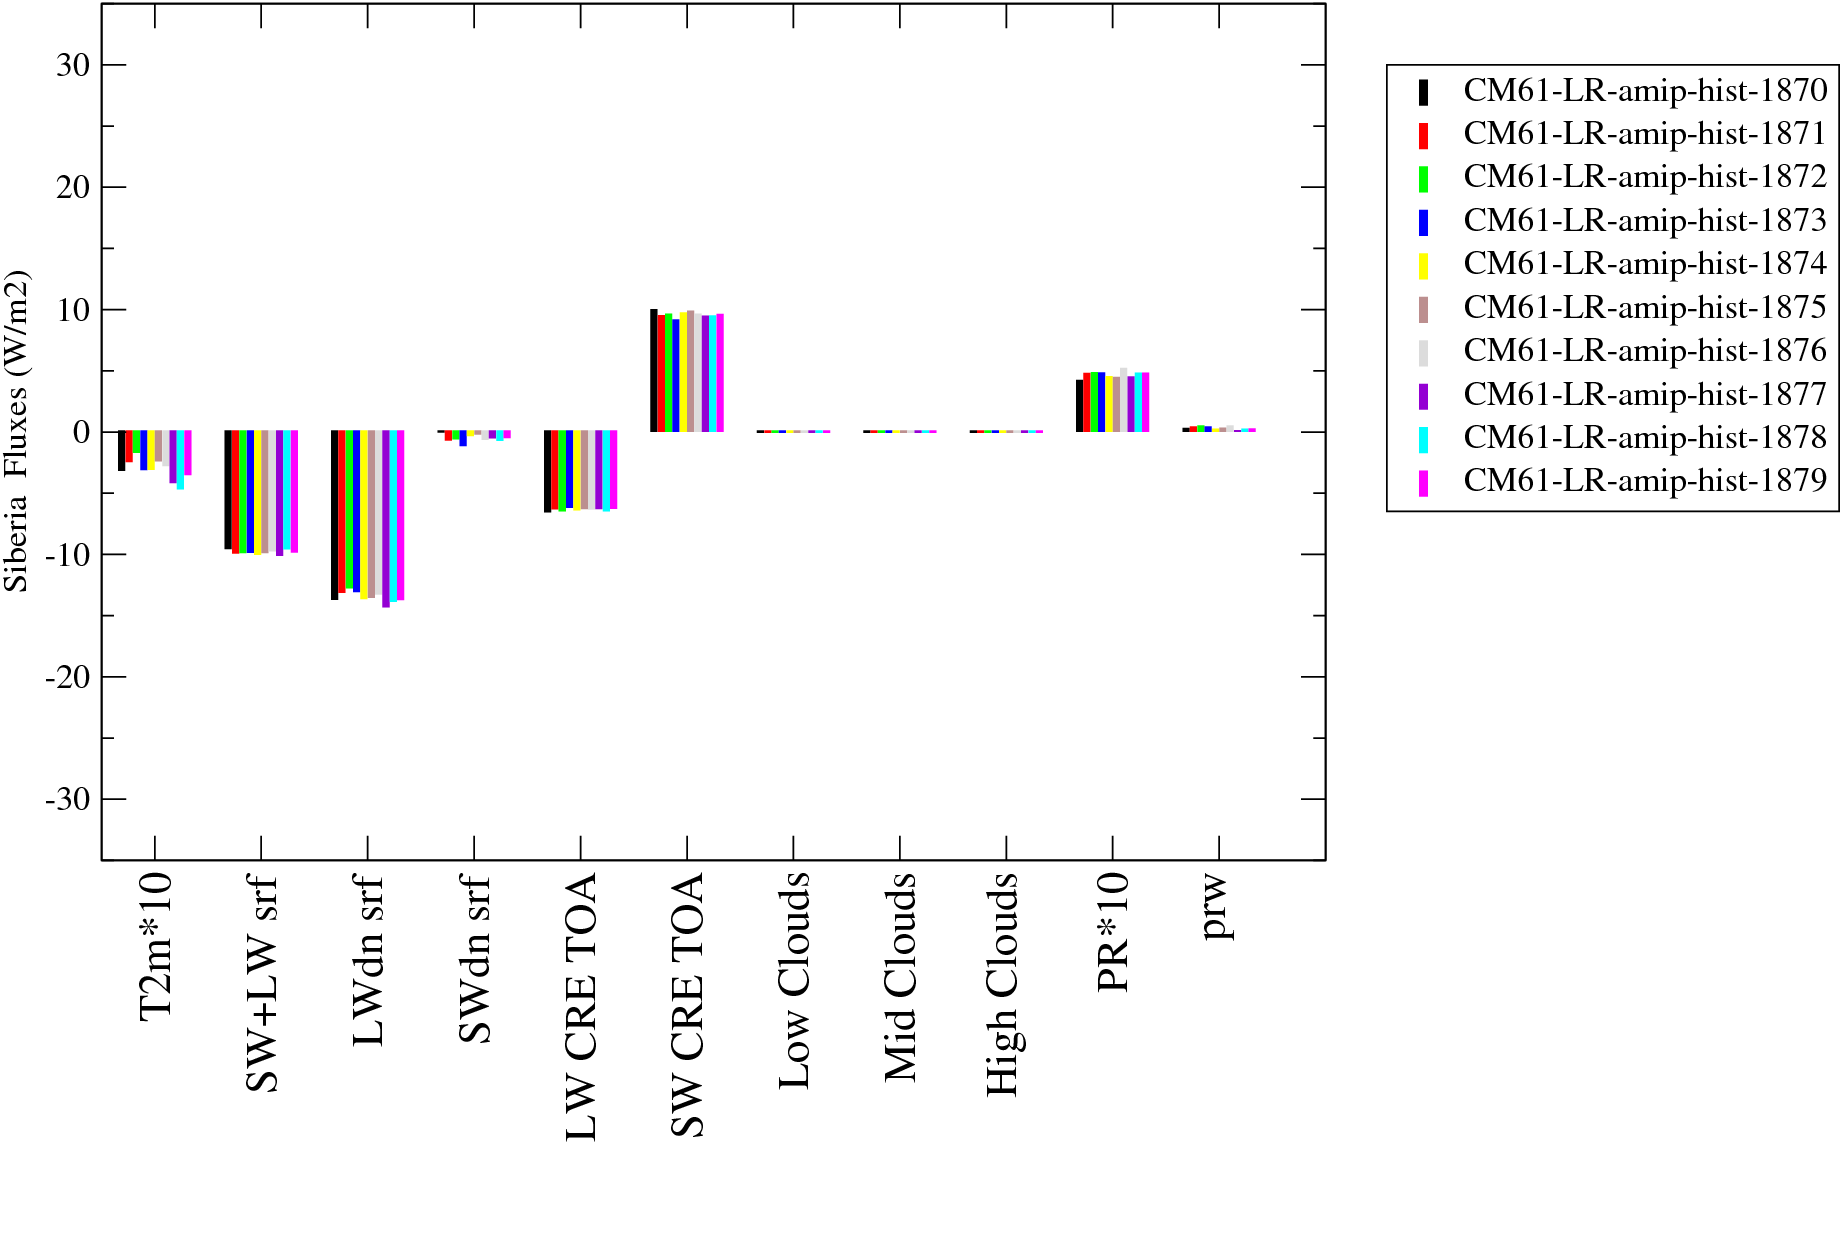 |
| RUN (link to outputs) | Atlas YEAR | Atlas --DJF-- | Atlas --JJA-- | Description of the simulation ___________________________________ | Period | Name (link to parameters) | bils | rt | rst | rlut | rlutcs | crest | crelt | cret | eva | pr | prw |
| CLIMATOS | 7.097 | 0.7823 | 240.4 | 239.6 | 269.4 | -47.05 | 29.84 | -17.21 | 3.415 | 2.61 | 27.46 | ||||||
| CM61-LR-amip-hist-1870 | G - - | G - - | G - - | amip-hist CMIP6 1er membre | 1870_1879 | CM61-LR-amip-hist-1870 | 2.2249 | 1.56 | 240.246 | 238.686 | 264.295 | -48.3923 | 25.609 | -22.7833 | 3.03356 | 24.2172 | |
| CM61-LR-amip-hist-1871 | G - - | G - - | G - - | amip-hist CMIP6 2eme membre | 1870_1879 | CM61-LR-amip-hist-1871 | 2.2211 | 1.537 | 240.162 | 238.625 | 264.275 | -48.4275 | 25.65 | -22.7775 | 3.03392 | 24.1947 | |
| CM61-LR-amip-hist-1872 | G - - | G - - | G - - | amip-hist CMIP6 3eme membre | 1870_1879 | CM61-LR-amip-hist-1872 | 2.0125 | 1.341 | 239.972 | 238.631 | 264.318 | -48.6301 | 25.687 | -22.9431 | 3.03788 | 24.2504 | |
| CM61-LR-amip-hist-1873 | G - - | G - - | G - - | amip-hist CMIP6 4eme membre | 1870_1879 | CM61-LR-amip-hist-1873 | 2.0965 | 1.399 | 240.11 | 238.711 | 264.344 | -48.51 | 25.633 | -22.877 | 3.03871 | 24.2538 | |
| CM61-LR-amip-hist-1874 | G - - | G - - | G - - | amip-hist CMIP6 5eme membre | 1870_1879 | CM61-LR-amip-hist-1874 | 2.1955 | 1.495 | 240.153 | 238.658 | 264.291 | -48.4445 | 25.633 | -22.8115 | 3.03499 | 24.2122 | |
| CM61-LR-amip-hist-1875 | G - - | G - - | G - - | amip-hist CMIP6 6eme membre | 1870_1879 | CM61-LR-amip-hist-1875 | 2.2362 | 1.545 | 240.194 | 238.649 | 264.3 | -48.4273 | 25.651 | -22.7763 | 3.03163 | 24.1854 | |
| CM61-LR-amip-hist-1876 | G - - | G - - | G - - | amip-hist CMIP6 7eme membre | 1870_1879 | CM61-LR-amip-hist-1876 | 2.115 | 1.425 | 240.075 | 238.65 | 264.316 | -48.5658 | 25.666 | -22.8998 | 3.03615 | 24.234 | |
| CM61-LR-amip-hist-1877 | G - - | G - - | G - - | amip-hist CMIP6 8eme membre | 1870_1879 | CM61-LR-amip-hist-1877 | 2.1326 | 1.427 | 240.05 | 238.623 | 264.295 | -48.5748 | 25.672 | -22.9028 | 3.03557 | 24.2107 | |
| CM61-LR-amip-hist-1878 | G - - | G - - | G - - | amip-hist CMIP6 9eme membre | 1870_1879 | CM61-LR-amip-hist-1878 | 2.2393 | 1.561 | 240.217 | 238.656 | 264.282 | -48.3858 | 25.626 | -22.7598 | 3.03497 | 24.2063 | |
| CM61-LR-amip-hist-1879 | G - - | G - - | G - - | amip-hist CMIP6 10eme membre | 1870_1879 | CM61-LR-amip-hist-1879 | 2.2304 | 1.558 | 240.123 | 238.565 | 264.252 | -48.4897 | 25.687 | -22.8027 | 3.03348 | 24.2053 | |
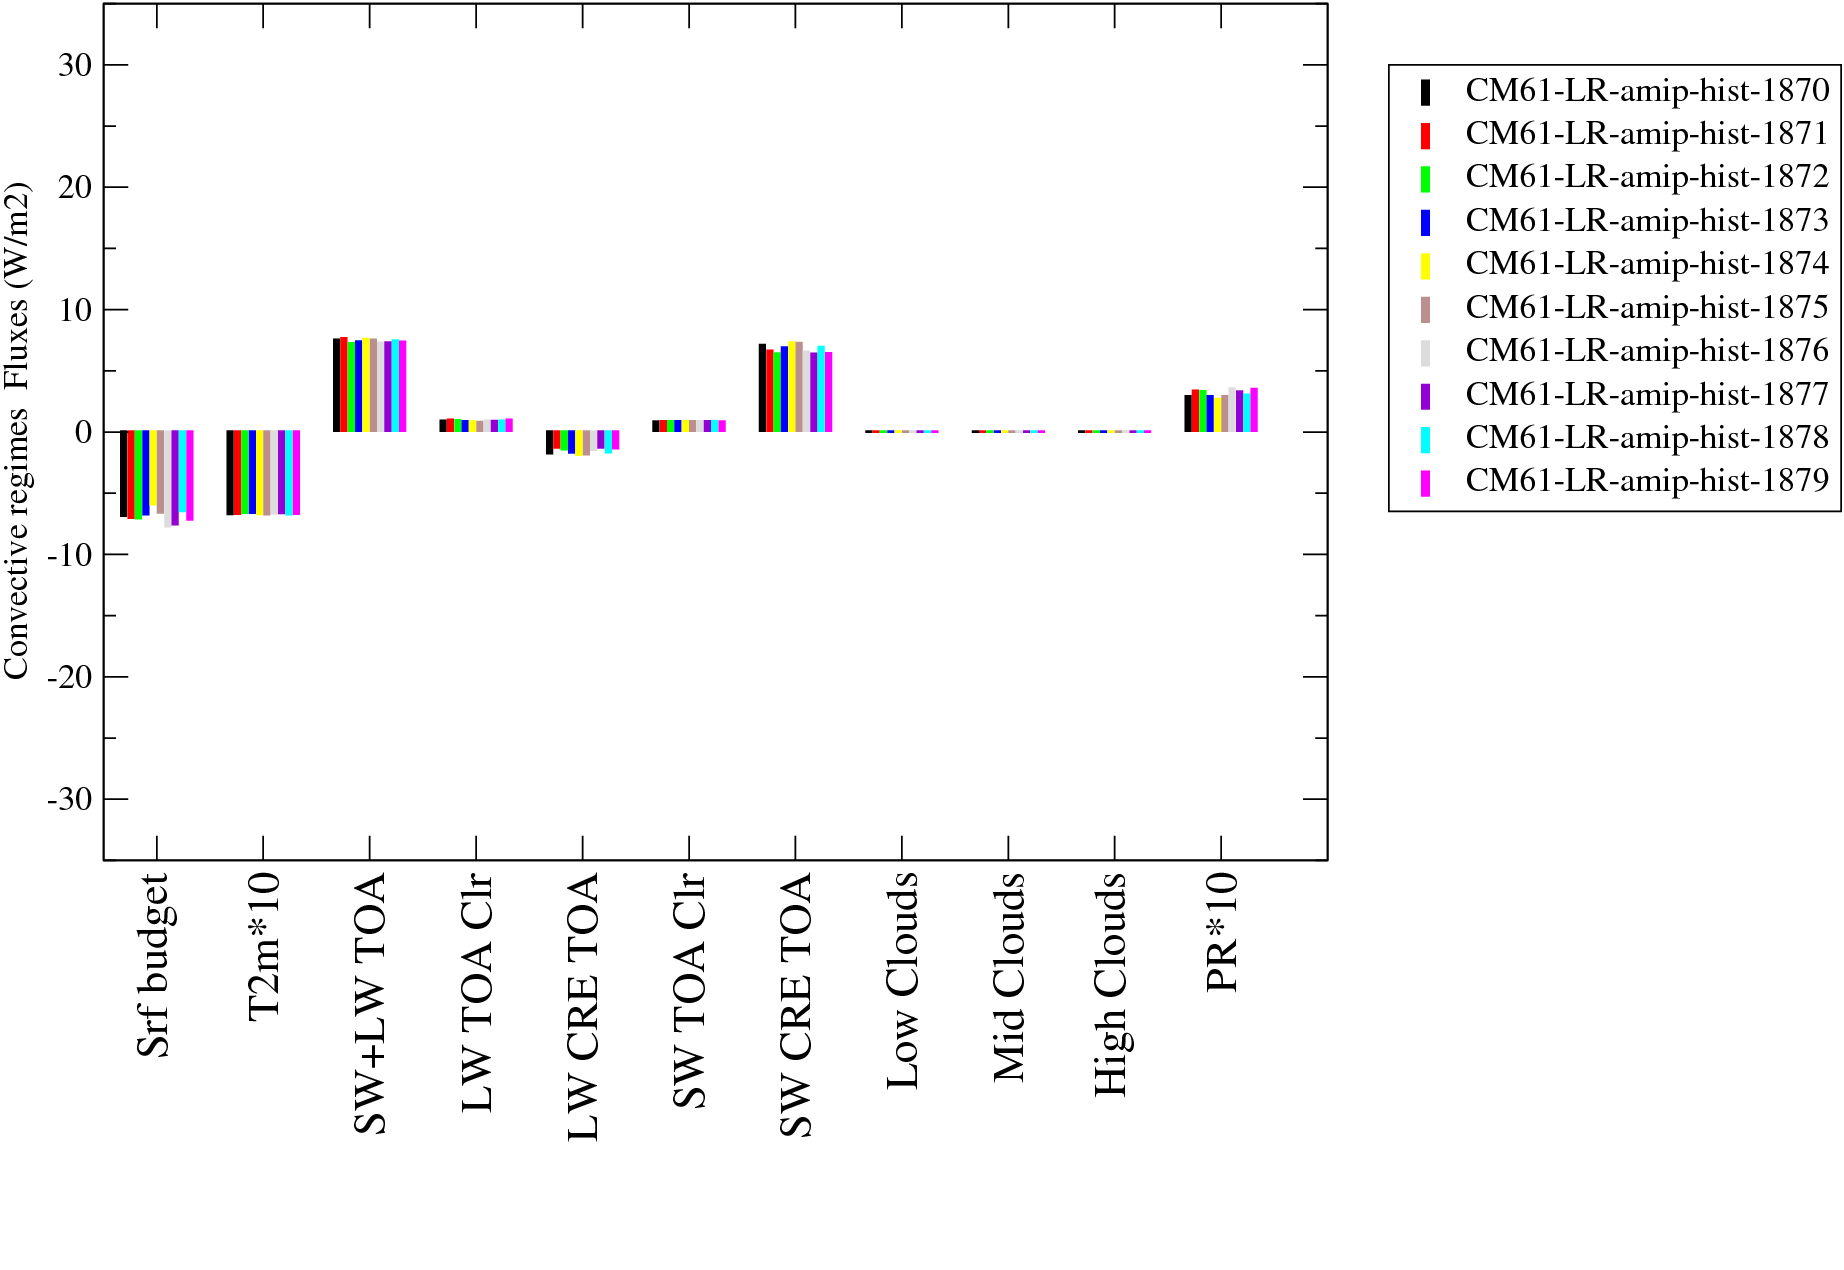
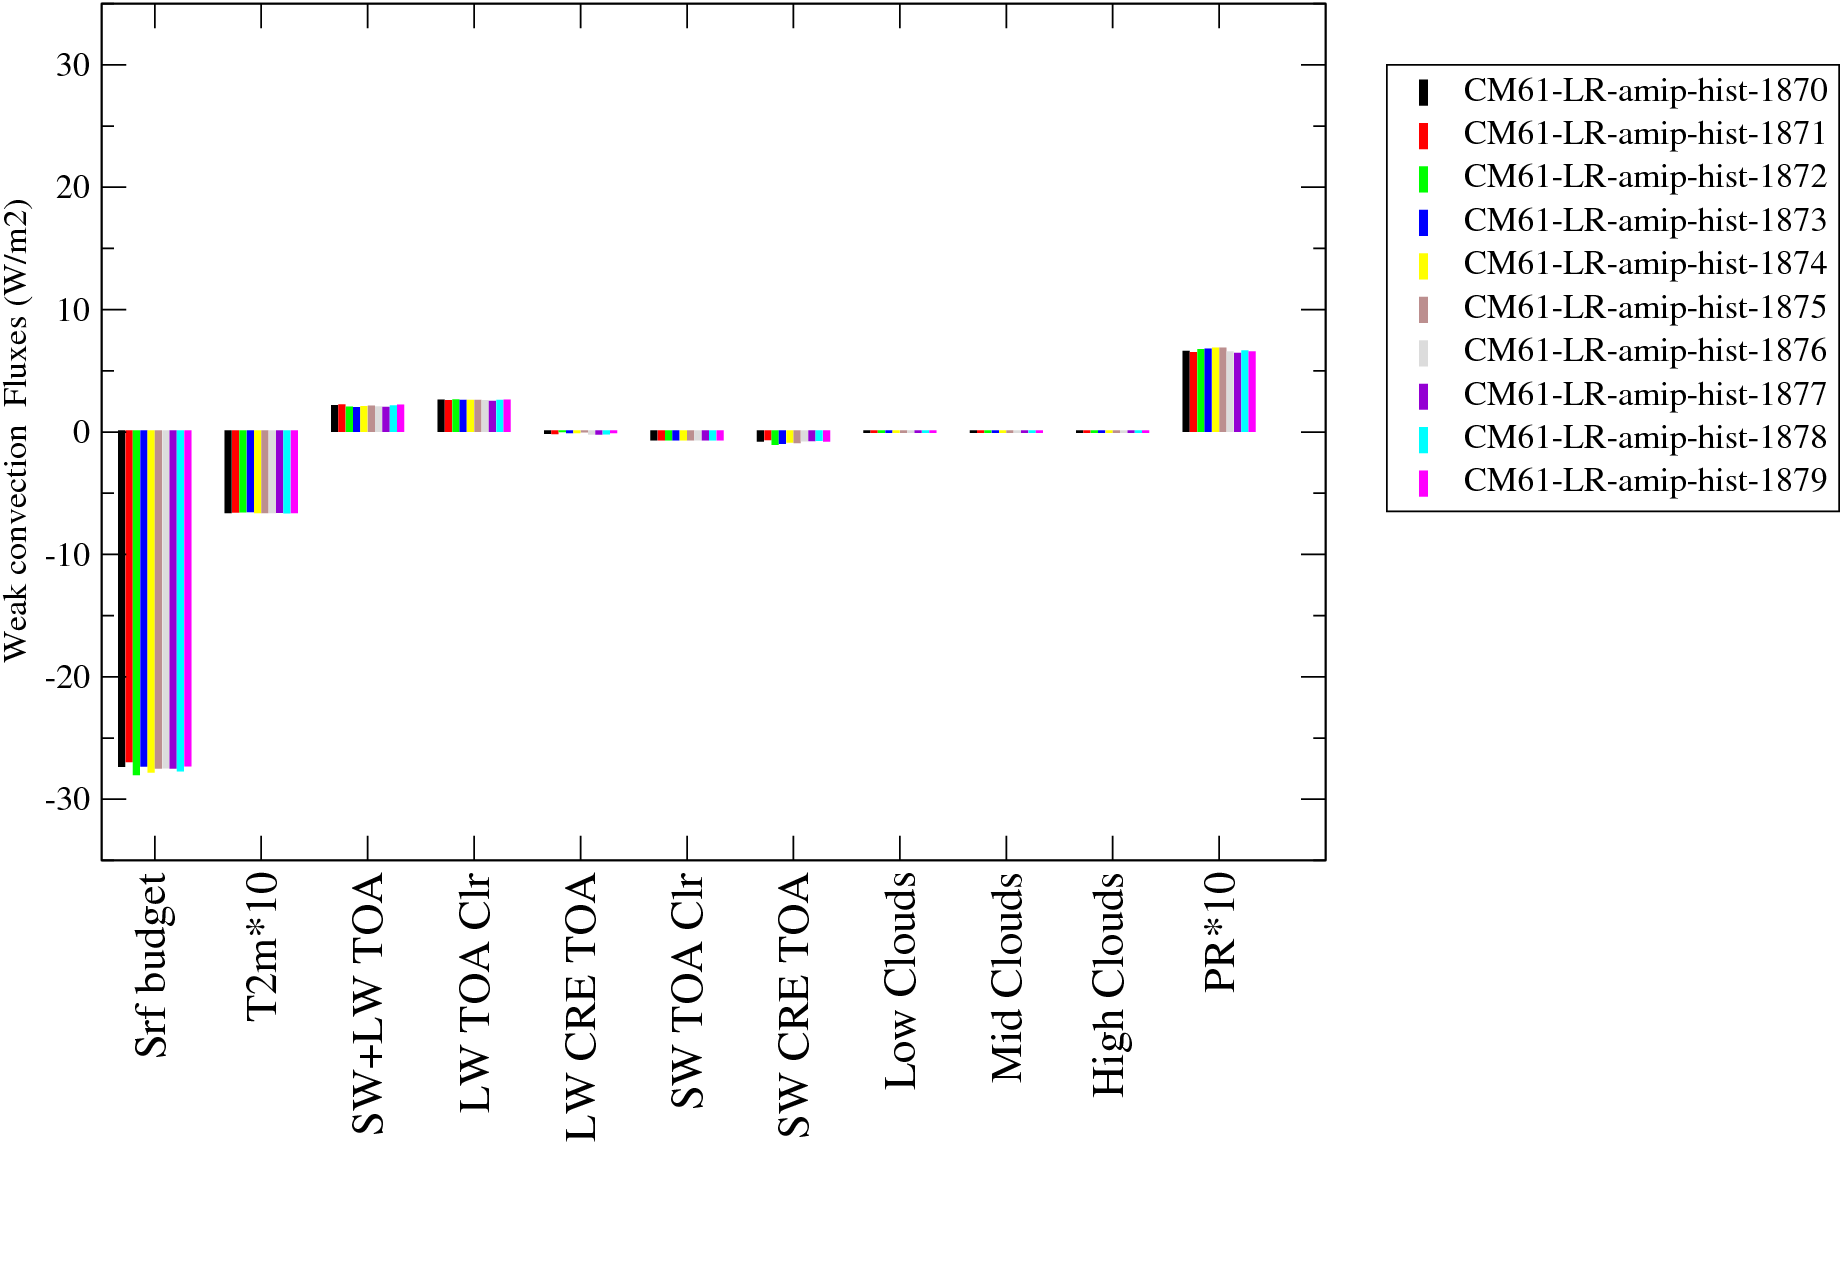
| Convective | Weak | Subsidence | ||||||
 |
 |
 |
||||||
 |
 |
 |
||||||
| ETO-Weak YEAR | circA DJF | Sibe JJA |
 |
 |
 |
 |
 |
 |